
|
For € 7.80, you can buy an eight-channel logic analyser in China with a maximum sampling rate of 24 MHz and data storage of up to 800 Msamples, more than you ever need. We tested the hardware and software. |
The hardware: 24M-8CH logic analyser
Who makes it and what is the type number?
That is a mystery, because the device itself does not have a brand name or type number and the suppliers are also mysterious about the origin. Internet sources claim that this device is a one-to-one clone of Saleae's much more expensive logic analyser 'LOGIC8'. That might be true, because the intention is that you download the Saleae software to get the analyser up and running. The device also seems to be compatible to the 'AX PRO' from USBee.
What is delivered
At Banggood, where we bought this analyser, you not only get the device itself, but also a USB-A to mini-USB cable of 80 cm and eight connecting wires 1 mm female to 1 mm female. This allows you to extend the eight inputs of the analyser, which are in a ten-pole mini-connector. But in fact, these wires are of no use at all, because first of all you need nine cables, the GND is also necessary, and secondly you cannot connect the analyser to anything with these cables.
The device is delivered with no manual or reference to a site where you can download the manual and necessary software.
 |
| The supplied components of this logic analyser. (© 2019 Jos Verstraten) |
It is wise to order a set of twelve 'test clamps for logic analyser'. Such a set costs just under five euros. These 26 cm test leads can be inserted into the ten-pole connector of the analyser on one side and clamped around a pin of an IC or a wire of an axial component on the other side.
 |
| With these handy test leads you can connect the logic analyser to your circuit. (© 2019 Jos Verstraten) |
 |
| Connect the logic analyser to the USB cable and to the test cables. (© 2019 Jos Verstraten) |
In the picture below we have presented the analyser a bit larger, with the dimensions of the device. But there is a second reason why we publish this picture so large. In the one we bought, pins 5 and 10 of the ten-pole connector are connected to ground. A careful examination of the photos of all suppliers shows that there are also specimens for sale where you can connect an external clock signal to pin 5. However, this is not necessary because the software gives all possibilities to sync on the inputs. Moreover, there are specimens where the channels are numbered from CH1 to CH8, but also specimens where the numbering runs from CH0 to CH7.
Under the semi-transparent label are two red LEDs. The top LED lights up when you power the device from 5 V via the USB cable. The bottom LED shows the logic level at CH1 or CH0. This LED will only light up if the logic level at this input is 'H'.
 |
| Detail of this logic analyser with its dimensions. (© 2019 Jos Verstraten) |
The small PCB in the enclosure has an amazing number of parts. In the picture below we present the two sides of the PCB. On the bottom is a stabiliser AMS1117-3.3 which reduces the 5 V USB power supply to 3.3 V for the microcontroller. This is a CY7C68013A from Cypress, which is dominantly present on the other side of the PCB. This microcontroller is brought to life by a 24 MHz crystal and works together with an EEPROM AT24C02N. The eight input signals are connected via safety resistors to a 74HC245 tri-state bus transceiver where the maximum input voltage of 5 V is adjusted to the signal levels of the microcontroller.
The 2 kb EEPROM contains the device configuration data, in particular the VID/PID combination. The VID is a 16 bit Vendor ID code and the PID is a 16 bit Product ID code. This allows the product to be identified as a 'Saleae USB Logic Analyser', allowing it to work with the official Saleae software. The EEPROM does not contain any firmware for starting the microcontroller. The firmware is loaded via USB when the software is started.
 |
| The two sides of the printed circuit board. (© 2019 Jos Verstraten) |
- Inputs: eight
- Input voltages: 5.25 V max.
- Input resistors: 100 kΩ
- Input capacities: 5 pF
- Power supply: 5 Vdc via USB cable
- Indicators: two LEDs
- Sampling speed: 24 MHz max.
- Interface: USB 2.0
The software Saleae Logic 1.2.18
Download and installation
The necessary software can be downloaded free of charge from the Saleae site, via:
https://www.saleae.com/downloads/
The software is available for Windows, Linux and Mac OSx. At the moment of this test, version 1.2.18 was the most current one. You get a .EXE file of 118 MB called 'Logic Setup 1.2.18.exe'.
The full 69 pages English manual of the software can be downloaded from:
http://downloads.saleae.com/Saleae+Users+Guide.pdf
We have installed the software on a Windows 7.0 system. Installing the software goes entirely automatically. After the program 'Saleae Logic 1.2.18' has been installed on your hard disk, the necessary USB driver is loaded. This driver will then automatically appear in the Windows Device Manager. If you connect the logic analyser to a USB port on your PC, Windows will automatically recognize the device.
 |
| The necessary USB driver is recognized by Windows. (© 2019 Jos Verstraten) |
Connect the eight inputs of the logic analyser to eight logic signals. Don't forget to connect the ground and do so as the very first connection! As a test we connected the analyser to eight outputs of a CD4020 '14 stage ripple counter' which was clocked via a transistor stage from the signal of our function generator. The circuit was powered with 5 Vdc and the generator was set to 10 kHz square wave.
The manual warns for unforeseen ground loops that can occur and that result in a current through the ground connection of the analyser. This current can damage the device. It is recommended that you always make a second ground connection between the power supply of your circuit and the frame of your PC, for example via a second cable. Do not turn on the power of your circuit until you have connected the analyser to your PC via its USB cable and the device is therefore powered. You must connect this logic analyser directly to a USB 2.0 port of your PC and not via a USB hub or a docking station.
Working with the software
Open the software and connect the analyser to a USB 2.0 port on your PC using the supplied USB cable. After a few seconds the text 'Connected' appears in the title bar of the application. At this moment, turn on the power of your circuit to be tested. Next to the 'Start' button in the upper left corner of the window you will see a button with two up and down pointing arrows. If you click on it, the window of the figure below will appear. The software has recognized the analyser as a 'Logic8' thanks to its Vendor ID and Product ID codes. In the left selection window you can set the speed or 'Sample Rate' in 13 steps between 25 ksamples/s and 24 Msamples/s. In the right selection window you can set the size of the measuring cycle in samples, seconds or milliseconds.
 |
| Setting the sampling rate and the length of a sampling cycle. (© 2019 Jos Verstraten) |
All you have to do is click the 'Start' button. The logic analyser scans the eight inputs for each sample and determines whether the inputs are 'L' or 'H'. This data is collected in the memory of your PC in a temporary file. The window below appears on your screen, where you can follow the collection of the samples and, if you wish, interrupt the process.
 |
| Collecting the samples. (© 2019 Jos Verstraten) |
After all the samples you have set have been collected or the sample time you have set has elapsed, that window disappears from your screen and all the collected samples are displayed at once. The scroll-bar at the bottom of the window allows you to scroll through the recorded samples. You can also do this by pressing the 'N' and 'P' keys on your keyboard. If you move your mouse to the sample window, you can use the scroll wheel of your mouse to increase or decrease the visible part of the samples. The same happens when you press the '+' or '-' keys on your keyboard.
 |
| The display of the logic levels at the eight inputs. (© 2019 Jos Verstraten) |
You can save the samples in a new tab by clicking on the '>>' box next to the 'Capture' tab. You can change the name of the tab by hovering your mouse over the tab name and double-click. Afterwards you start with an empty tab and you can start a new measurement.
 |
| Saving the collected samples on individual tabs. (© 2019 Jos Verstraten) |
All eight traces are displayed in white. However, you can switch to a color display. Go to 'Options' (top right) and open 'Preferences'. Go to the 'Interaction' tab and check the 'Use Color' option.
Setting the channels
The menu for setting the channels
The eight channels are defined by a channel number and a channel name. The number obviously refers to the channel numbers on the input connector of the logic analyser. Remember that what in the software is 'Channel 0' on the device can be 'Channel 1'! The figure below shows which settings you have per channel.
 |
| Setting the channels. (© 2019 Jos Verstraten) |
If you move the mouse over the channel number area, the cursor changes into a hand and you can drag the channel to another location.
Changing the channel name
If you double-click with the mouse in the field with the channel name you can change it.

The Channel Settings
This setting allows you to increase the amplitude of the channel by a factor of 2, 4 or 8. With 'Hide This Channel' the channel disappears from the screen. With 'Show All Channels' all channels are displayed again. 'Reset All Channels' restores the channel display to its original values, including order and names.
The trigger settings
Trigger conditionsIf you do not set a trigger condition, the software will start registering the samples when you click 'Start'. With the trigger settings, however, you can link the start moment of recording the samples to the signal flow on one or more channels. You can set per channel:
- Triggering on a leading edge.
- Triggering on a trailing edge.
- Triggering at a high level with an adjustable time.
- Triggering at a low level with an adjustable time.
The last two options allow you to set a minimum and/or a maximum time in ns, μs, ms and s.
If you set the trigger conditions of one channel, the trigger conditions of all other channels are set to 'Don't Care', a cross will appear in the 'Trigger Settings'. You can of course combine the trigger conditions of various channels. If you have set a trigger condition on one channel, you can only set an 'L' or 'H' as trigger condition on the other channels, without further specification.
Performing measurements on the traces
Immediate display of the signal parameters
Click with the right mouse button on one of the traces. In the popup window, select which parameters of the signal you want to measure:
- Width
- Frequency
- Period
- Duty Cycle
Click on 'Show Digital Instantaneous Measurement'. If you now move to a trace you will immediately see the checked parameters appear for the selected period of the trace.
 |
| Measurements on the traces of the channels. (© 2019 Jos Verstraten) |
The right column of the software window contains three words:
- Annotations.
- Analysers.
- Decoded protocols.
By clicking on 'Annotations' you can display measurement data in this right column. Click on '+' and you will get three choices:
- Timing Marker pair.
- Bookmark.
- Measurement.
Timing Marker Pair
With this option you can mark two places in the data. After clicking on this option, this notation appears in the 'Annotations':
ǀ A1 - A2 ǀ = ####
Click on 'A1' and move the cursor to where you want to place this marker. Repeat for 'A2'. The markers are represented by two vertical lines in the traces and the 'Annotations' column shows the time difference between the two markers. You can add multiple markers to the dataset. The same result is obtained by moving the cursor to the desired location and then pressing one of the number keys on your keyboard.
Bookmarks
With this option you can assign a name to a magnified part of the data. Afterwards, you can click on the name of the bookmark to view the magnified part of the dataset again.
 |
| Setting 'Markers' and 'Bookmarks'. (© 2019 Jos Verstraten) |
When you click this option you will see a list of the parameters you can measure:
- Width.
- Frequency.
- Average Frequency.
- Average Duty Cycle.
- Count of Rising Edges.
- Count of Falling Edges.
- Count of Positive Pulses.
- Count of Negative Pulses.
- Minimum Positive Pulse Width.
- Maximum Positive Pulse Width.
- Minimum Negative Pulse Width.
- Maximum Negative Pulse Width.
- Period.
- Average Period.
- Count of Complete Periods.
Data saving and loading
Save or load a tab with data
'Options' and 'Save capture' allow you to save the current tab with traces for future use. Via the same menu, but then the option 'Open capture/setup' you can put an old set of data in a tab again.
Exporting the data
'Options' and 'Export data' allows you to export your measured samples to various formats that can be read in other programs, such as CSV, Binary, VCD and MatLab.
Protocol analysers
What are Protocol analysers?
'Protocol analysers' decode measured data that is encoded according to a certain protocol. The software currently offers no less than 24 protocol analysers:
- Async Serial
- I2C
- SPI
- 1-Wire
- Atmel SWI
- BiSS C
- CAN
- DMX-512
- HD4478O
- HDLC
- HDMI CEC
- I2S / PCM
- JTAG
- LIN
- MDIO
- Manchester
- Midi
- Modbus
- PS2 Keyboard/Mouse
- SMBus
- SWD
- Simple Parallel
- UNI/O
- USB LS
Fill in specific data
For each selected protocol, you must first fill in a window with specific data. However, this requires a thorough knowledge of the in's and out's of the chosen protocol, which goes beyond our rudimentary knowledge of these protocols.

USB 2.0 Logic analyser 24 MHz 8 CH 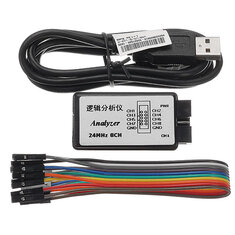
|
12 Pcs Test-Clip for Logic analyser 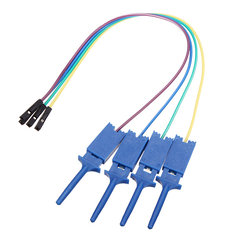
|