
|
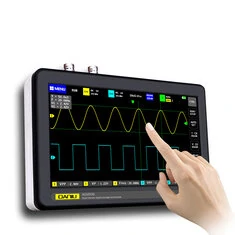
The ADS1013D is a two-channel tablet oscilloscope with, according to the manufacturer, a bandwidth of 100 MHz, a sampling rate of 1 GSa/s and a price of € 120.00. A great hobby oscilloscope? We tested the specifications and operation. |
Introduction to the ADS1013D tablet-scope
Scope of delivery, price and manufacturer
The ADS1013D is offered under various brand names, we found on the internet:
- Daniu
- FNIRSI
- KKmoon
The prices of the deals are quite different, from € 120.46 to over $ 200.00, so a good search is worthwhile.
The device comes in a sturdy unbranded box containing the following parts:
- The ADS1013D oscilloscope.
- Two 100 MHz 1/1 and 1/10 probes.
- A two meter (!) long USB lead for charging and data transfer.
- A power supply 5.0 V / 2 A with American (!) plug.
- A small poorly translated but readable English manual.
The fact that no Euro-adapter for the power supply is included is of course a big mistake! Such a part costs sixty cents in China!
 |
| The scope of delivery. (© 2020 Jos Verstraten) |
The ADS1013D tablet oscilloscope
The oscilloscope is mounted in a sturdy plastic housing measuring 18.5 cm x 12.5 cm x 5.0 cm. The weight of the device is 612 grams. The screen is a 7 inch (17.78 cm) colour TFT LCD display with a resolution of 800 by 480 pixels.
In the bottom is a recessed backrest which you can fold out and makes that the oscilloscope stand at an angle of 50° on your worktable.
The device is powered by a 6,000 mAh lithium battery which guarantees a working time of four hours after a full charge. Charging the fully discharged battery takes five hours.
 |
| The appearance of the ADS1013D oscilloscope. (© Banggood) |
The connections
All connections and the on/off button are on the top of the housing. The picture below shows, from left to right:
- The BNC connector for channel 1.
- A contact with a 1 kHz square wave (for adjusting the measuring probes).
- The BNC connector for channel 2.
- A red LED that lights up when the battery is being charged.
- A green LED that lights up when the battery is full.
- A micro-B USB connector for connecting the charging cable.
- The on/off push button.
 |
| The upper side of the device. (© Banggood) |
The oscilloscope probes
The two oscilloscope probes are the standard cheap probes that are delivered with every Chinese oscilloscope. The flexible cable has a length of about 120 cm. Via a slide switch on the probe you can switch between 1/1 or 1/10 attenuation. Via an adjustment screw at the BNC connector you can capacitively compensate the built-in attenuator with the 1 kHz square wave.
Because the cable has a rather high capacity, the bandwidth in the 1/1 position is specified as only 5 MHz. If you need to measure signals with higher frequencies, you must use the probe in the 1/10 position. Because the maximum sensitivity of the device is 50 mV/div, this means that the sensitivity drops to 0.5 V/div for such measurements. This is of course a rather low value for an oscilloscope that must be universally usable.
 |
| The supplied oscilloscope probes. (© Banggood) |
The specifications of the ADS1013D
The manufacturer guarantees the following specifications:
- Analogue bandwidth: 2 x 100 MHz
- Number of channels: 2
- Input resistance: 1 MΩ
- Input capacity: not specified
- Coupling mode: AC ~ DC
- Maximum voltage: 40 V (1/1 probe), 400 V (1/10 probe)
- Probe compensation: 1x ~ 10x ~ 100x
- ADC resolution: 8 bit
- Real-time sampling rate: 1 GSa/s
- Vertical sensitivity: 7 ranges, 50 mV/div ~ 5 V/div
- Time base range: 30 ranges, 50 s/div ~ 10 ns/div
- Rise time: less than 3 ns
- Accuracy of voltage measurements: ±2.0 %
- Accuracy of frequency measurements: ±0.01 %
- Memory range: 240 kb
- Trigger mode: single ~ normal ~ automatic
- Triggering: rising edge ~ falling edge
- FFT analysis: yes
- Automatic setting: yes
- Freeze mode: yes
- USB interface: yes, read as external drive
- X/Y mode (Lissajous): yes
- Cursor measurements: voltage ~ time ~ frequency
- Storage capacity: 1 GB (1,000 screenshots)
- Numerical data: 12 per channel
- Touchscreen: capacitive, click and swipe
Working with the ADS1013D
The screen of the oscilloscope
The picture below shows the screen of the ADS1013D. The display is divided into four zones. At the top of the screen there are a number of colored areas that you can click to open a menu. On the right are a number of texts in a command list that you can click and which will result in an action. At the bottom of the screen are the numerical values of the parameters activated for both channels.
In the oscillogram section of the screen you will see four arrows that you can swipe up and down or back and forth with your finger.
The left yellow and blue arrows move the zero line of both signals up and down. The right green arrow defines the trigger level on one of the two signals. The top green arrow selects the part of the stored samples that is displayed on the screen. This is ideal if, for example, you have measured a single narrow pulse. You can then quickly scroll through the entire memory in search of that pulse.
 |
| The screen of the ADS1013D. (© 2020 Jos Verstraten) |
Working with the ADS1013D
It is very simple. Switch the device on with the push button on top, connect both signals to the BNC connectors and click on the text 'AUTO SET'. You will then hear a number of relays switching and after one or two seconds the oscillograms will appear on the screen. Sometimes the 'AUTO SET' is not able to put the image on the screen in the easiest way to interpret and you have to set the sensitivities and/or the time base by hand.
Manual setting of time base and sensitivity
Setting the time base manually is easiest. Click anywhere in the left half of the screen to slow down the time base, click anywhere in the right half of the screen to speed up the time base. Like most low-cost Chinese oscilloscopes, the ADS1013D has a large but impractical time base range. You can choose from 30 ranges from 50 s/div to 10 ns/div in the known 1/2/5 ratio. No doubt you will hardly ever use the ten slowest speeds! The fastest setting of 10 ns/div is in fact too slow for a 100 MHz oscilloscope. If you connect a 100 MHz signal to the input, you see thirteen periods on the screen with the fastest setting. A detailed study of the signal is then not possible.
Setting the sensitivity manually is slightly different. Click on the text 'CTRL' in the top right corner of the screen. The contents of the screen's right-hand command list will change, as shown in the figure below. You see four clickable symbols 'V+' and 'V-' to set the sensitivity of both channels. Ready? Then click the text 'CTRL' again and the normal contents of the command list will reappear.
 |
| Switch to the sensitivity setting. (© 2020 Jos Verstraten) |
Very poor sensitivity
By the way, the ADS1013D is not very sensitive. A maximum sensitivity of 50 mV/div is not enough for a universal oscilloscope. If you work with the 1/10 position of the probes, the maximum sensitivity is even 0.5 V/div and that is not very good. For comparison: a non-professional desktop oscilloscope like Hantek's DSO5102P has a maximum sensitivity of 1 mV/div. At this point, the designers of this oscilloscope clearly missed an opportunity to design a universal usable device!

Basic settings of the two channels
After clicking on the buttons 'CH1' or 'CH2', the window below appears on the screen. In this window, you can define four properties of the two channels:
- open CH:
The channel in question is activated. - open FFT:
An FFT analysis is applied to the signal (read later). - coupling:
A DC voltage present on the signal is displayed (DC) or not (AC). - probe mode:
The numerical voltage measurements take into account the attenuation of the probe. If you set the probe to the '1/10' position, you must select the option '10x' here.
 |
| The settings of the two channels. (© 2020 Jos Verstraten) |
Triggering setting
By clicking on the 'T' button you can set the way of triggering:
- trig mode:
Selects between the three standard modes 'auto', 'normal' or 'single'. The automatic trigger mode is the standard mode and you can select it in most cases. Because the ADS1013D has very few options for triggering, the difference between the modes 'auto' and 'normal' is not clear. The 'single' mode is selected when you are waiting for a signal that appears only once or irregularly. Only when the signal appears, the oscilloscope will start sampling the signal. - trig edge:
Triggers on the positive (rising) or negative (falling) edge of the signal. - trig CH:
Triggers on channel 1 or channel 2.
 |
| The triggering settings. (© 2020 Jos Verstraten) |
The 'MEASURES' menu
After a click on the 'MEASURES' button on the right side of the screen, the window below appears on the display. You can select up to twelve parameters you want to see the numerical value on the screen: VPP, VP, Vmax, Vmin, Vavg, Vrms, Freq, Duty+, Duty-, Time+, Time-, Cycle. Some of these parameters are rather unimportant and you will probably never want to see them. The useful specifications are:
- Vrms:
The root-mean-square value of the voltage in volt. - VPP:
The peak-to-peak value of the signal in volt. - Freq:
The frequency of the signal in hertz. - Cycle:
The period of the signal in seconds. - Duty+:
The on/off ratio (duty-cycle) of the signal in percent. If you know 'Duty+' you of course also know 'Duty-'.
 |
| Selection of the numeric data you want to see on the screen. (© 2020 Jos Verstraten) |
The 'System settings' of the ADS1013D
After a click on the blue 'MENU' button in the top left corner, the left window shown in the figure below appears. Click on the 'System setting' to open the right window. The five options in this submenu are quite clear:
- Screen brightness:
After clicking on this option, a slide potentiometer appears to adjust the intensity of the screen. - Grid brightness:
The same story, but now for the intensity of the grid on the screen. - Always trigger 50%:
The oscilloscope always triggers at half of the peak-to-peak value of the signal. - Baseline calibration:
Ensures that the vertical position of the two arrows '1' and '2' corresponds to 0 V. - X-Y mode display:
The two voltages at the inputs are displayed in an X/Y coordinate system. As a result, the famous Lissajous shapes on the screen allow you to display the frequency and phase relationship between the two signals.
 |
| The 'System setting' from the main menu. (© 2020 Jos Verstraten) |
Picture view and Waveform view
The right command list contains the two options 'SAVE PIC' and 'SAVE WAVE'. Both options allow you to store the instantaneous image in the memory of the oscilloscope. With 'Picture view' a static storage is performed. A photo of the screen is taken and this picture is saved. With 'Waveform view' a dynamic storage is performed. You can then manipulate the saved signal again as if it were present on one of the inputs. For example, you can set the sensitivity and time base to values other than those that were active when the 'SAVE WAVE' button was pressed.
No less than 1 GB of memory is available for this storage, good for an average of 1,000 pictures or waves. Clicking on the 'Picture view' or 'Waveform view' options in the main menu will display all saved screenshots in thumbnails as shown below. In this example, five pictures are stored in memory. The function of the six commands in the right-hand column is clear and requires no further explanation. You can open one of the pictures or waves by clicking on it. The selected image reappears in the oscilloscope's standard screen.
 |
| The screen after the 'Picture view' option. (© 2020 Jos Verstraten) |
Measuring with the cursors
With the options 'T CURSOR' and 'V CURSOR' you place two vertical and two horizontal cursors respectively in the image that you can move with your finger. In this way you can, for example, determine the rise time of a pulse or the overshoot that is present on it. The values of the time and/or the voltage between the cursors appear in a frame (top left) in the image.
 |
| Measuring a part of the signal with the cursors. (© 2020 Jos Verstraten) |
Move fast / move slow
In this context, it may be useful to point out that you can set the speed at which the screen responds to swipes. At the top of the screen you see the text 'move fast'. With this default setting, the screen follows the movements of your finger one by one across the display. If you move your finger one centimetre, the image will also move one centimetre. If this happens too fast, click on 'move fast'. The text changes to 'move slow'. Now the screen follows the movements of your finger much slower so that you can position the cursor lines more accurately.
In this context, it may be useful to point out that you can set the speed at which the screen responds to swipes. At the top of the screen you see the text 'move fast'. With this default setting, the screen follows the movements of your finger one by one across the display. If you move your finger one centimetre, the image will also move one centimetre. If this happens too fast, click on 'move fast'. The text changes to 'move slow'. Now the screen follows the movements of your finger much slower so that you can position the cursor lines more accurately.
USB Connection
This last option of the main menu allows you to copy the images stored in the memory of the oscilloscope to your PC for further editing. Connect the ADS1013D with the supplied USB cable to a USB port of your PC. Click on the 'USB Connection' option in the main menu. The screen will change to the icon below.
In Windows explorer, the oscilloscope is now displayed as a 'Removable Disk' and you retrieve all saved 'Pictures' as BMP files. You can copy these to your hard disk and convert them to the more common JPG format.
Exit this option by clicking the 'ON/OFF' button in the image below.
 |
| The ADS1013D becomes an external drive of your PC. (© 2020 Jos Verstraten) |
Video: the operation of the ADS1013D
To show how easy it is to operate this oscilloscope, we have copied the video below from cloud.video.taobao.com. Six and a half minutes playing with this great device!
The electronics in the ADS1013D
An easily accessible PCB
Both parts of the enclosure are connected by only five small screws. After removing these screws you can pull both parts of the housing apart and it turns out that all the electronics are on one big PCB that fills the entire casing, see the picture below. The numbers in the green circles are of course not on the PCB, but we have added them for the identification of the chips, read on. The battery is glued to the back of the housing and is connected to the PCB with a small cable.
The first thing to notice is that there is absolutely no shielding on the PCB. In most digital oscilloscopes, the two input circuits are carefully shielded with metal plates to prevent the picking up of interference signals from the digital part. This may not be necessary for a device with a sensitivity of only 50 mV/div. There is, however, a metal shield between the PCB and the display.
 |
| The electronics are on one large PCB. (© 2020 Jos Verstraten) |
Image storage on a memory card
The first thing you will notice, approximately in the middle of the print, is a metal holder for a memory card. There is indeed a card in this holder and it is obvious to assume that the 1,000 pictures are stored on this card.
Identification of the chips
We obviously wants to know what kind of chips are present in a device. We have been able to identify most ICs, see the numbers in the green circles:
- 1
Two pieces TP4058 from NanJing Top Power ASIC Corp. regulate the charging of the lithium-ion battery. One chip is capable of delivering a charging current of 600 mA. - 2
An SPX29302T5 from Sipex, this is a 5 V ~ 3 A low-drop voltage stabilizer. - 3
An AMS1117 is a 3.3 V ~ 1 A low-drop voltage stabilizer. - 4
A TPS61040, this is a step-up boost-converter that probably provides the voltage for the display. - 5
Unfortunately, the code on this chip cannot be deciphered. - 6
This is an F1C100S, an ARM9 processor of the very latest generation of Allwinner Tech. The strange thing is that according to the datasheet, this processor is intended as a video and audio processor. - 7
A Cyclone IV by Altera, an FPGA or 'Field Programmable Gate Array'. Such a circuit consists of thousands of programmable logic components. These can be programmed as logical functions such as AND, XOR and so on. - 8
Two AD9288 type ADCs that sample the two analogue input signals. Each chip contains two identical 8 bit wide ADCs with a maximum sampling rate of 100 MSa/s. It is difficult to understand how such chips can achieve a real-time sampling rate of 1 GSa/s, as the manufacturer claims. If both ADCs in one chip sample the same signal in parallel with a phase shifted clock signal, then the sampling frequency is 200 MSa/s. The hardware sampling speed is therefore probably much lower and an oversampling algorithm is applied via the software. This is not exceptional, most digital oscilloscopes use this kind of trick. But don't call it 'real-time'! - 9
This is a 16 MB flash memory type W25Q16 from Winbond. It is most likely that it contains the firmware of the oscilloscope. To the right of this chip there are a number of pads where one can undoubtedly install a programming connector. - 10
Two pieces BU4317G-TR from Rohm Semiconductor. These are voltage detectors that probably play a role in detecting the voltage level at the inputs and control the 2 x 3 relays (the white parts) in the input attenuators via the firmware.
The ADS1013D on the test bench
Operating time with a full battery charge
According to the specifications, you can work for four hours with a full battery charge. In practice, this is even much more. We charged the battery until the green LED turned on. After that, the charger was disconnected and the oscilloscope was kept in continuous use. Only after six hours and forty minutes did the ADS1013D suddenly stop working.
Interference from HF signals
Because little has been done about shielding, we were curious about possible interference from HF signals from the digital parts. With both inputs open, both sensitivities are set to 50 mV/div. Two straight lines are written on the screen without any kind of interference or noise.
The analogue bandwidth
According to the specifications, the analogue bandwidth is 2 x 100 MHz. This specification has been questioned in various reviews, but without providing any evidence. So we have tested this important specification by using the signal from our Marconi TF2015 high frequency sine generator as source. It provides a constant signal to 100 MHz within ± 1 dB. We applied a 10 MHz sine wave to the oscilloscope and marked the positive and negative peaks of the signal on the screen with the two horizontal cursors, shown in green in the figures below. Afterwards we increased the frequency of the TF2015 to 25 MHz, 50 MHz and 100 MHz. From the screenshots you can see how the amplitude of the signal on the screen decreases quite rapidly. So there is no bandwidth of 100 MHz at all! If the bandwidth of an oscilloscope is defined as the frequency at which the amplitude has decreased by 3 dB, then the real bandwidth of the ADS1013D will be somewhere around 20 MHz.
By the way, it is noticeable that the sine waves are displayed very nicely on the screen without being bothered by the notorious quantization artifacts. Also the 100 MHz signal, although very weak, is still easy to interpret and has a nice shape.
 |
| Sine waves with identical amplitudes of 10 MHz, 25 MHz, 50 MHz and 100 MHz. (© 2020 Jos Verstraten) |
Accuracy of frequency measurements
From the picture above you can also see how well the ADS1013D measures the frequency of the input signal. There is nothing to complain about, even the frequency of the 100 MHz signal is displayed as 'Freq : 100MHz'. However, it should be noted that the frequency is displayed with only three digits. The specified accuracy of ±0.01 % is therefore a real value.
Accuracy of alternating voltage measurements
The ADS1013D is capable of measuring the rms value of an AC voltage with a specified accuracy of ±2.0 %. We checked this by supplying sine wave signals with a frequency of 1 kHz and with a precisely set rms value to the input of the oscilloscope. Via the 'AUTO SET' the device determined its best settings for each measurement. The results are summarized in the table below. The tested specimen does not always meet the specified accuracy.
Switching the signal shape from sine to square or to triangle changes little to the rms value displayed by the oscilloscope. So this is excellent!
 |
| The accuracy of the measurement of a.c. voltages. (© 2020 Jos Verstraten) |
Display of square waves
To test the display of square waves we connect a TTL signal with a frequency of 5 MHz to both our Hantek DSO5102P and the ADS1013D. You can see the two results in the figure below. It is clear that the ADS1013D has a much worse rise time than the DSO5102P.
 |
| The display of a 5 MHz TTL signal compared. (© 2020 Jos Verstraten) |
Measuring the rise time
We therefore do not believe in the specified rise time of 3 ns. To confirm this suspicion, we applied a very fast pulse to both oscilloscopes and used the horizontal and vertical cursors to measure the rise time of the pulse. In the oscillogram below you can see the result for the ADS1013D. The rise time was measured as approximately 21.2 ns. For comparison: the same measurement on the DSO5102P gave a value of about 3.9 ns!
 |
| Measuring the rise time of the oscilloscope. (© 2020 Jos Verstraten) |
Triggering on narrow pulses
An important feature of an oscilloscope is its ability to trigger on very narrow pulses. To test this we have generated such a pulse with a frequency of 100 kHz and a duty-cycle of 1 %. In the picture below you can see on the left the image on our DSO5102P and on the right the same pulse on the ADS1013D. This oscilloscope triggers excellent on such narrow pulses! However, the numerical voltage and frequency measurements do not work.
 |
| The very stable triggering on a very narrow pulse. (© 2020 Jos Verstraten) |
Fast Fourier Transform
All digital oscilloscopes, from the cheapest to the most expensive, have the possibility to perform an FFT analysis on the input signal. The software then investigates which harmonic frequencies are present in the input signal and examines the amplitude relationships between these harmonics. The results are displayed in a graph. With all inexpensive oscilloscopes this feature is completely useless, and the ADS1013D is no exception.
In the oscillogram below we have displayed the FFT analysis of a 1 kHz square wave. The purple FFT analysis cannot be moved across the screen, nor can it be enlarged or reduced. Moreover, scales are missing, so you don't know what you see. In short, a completely unusable function with no practical application of any kind.
 |
| The completely useless FFT analysis of the ADS1013D. (© 2020 Jos Verstraten) |
X-Y mode display
In this mode, you must consider the screen as a display system with a vertical axis and a horizontal axis. The first channel controls the horizontal x-axis, the second the vertical y-axis. If you connect two DC voltages to both inputs, only one point will appear on the screen with the coordinates x and y given by the voltages on both inputs.
If you apply sine voltages of the same frequency to both inputs, lines, circles and ellipses will be written on the screen. The shape of these images depends not only on the size of the sine voltages, but also on their phase relation. If you apply sine voltages with different frequencies to both inputs, then all kinds of complicated curves will be written on the screen.
The curves that appear on the screen are called 'Lissajous-figures' after Jules Antoine Lissajous (1822-1880). He obtained these figures by sequentially reflecting light through two mirrors attached to two tuning forks at right angles to each other.
The ADS1013D also works very well in this mode, as the oscillogram below shows. The ellipse proves that the two signals have the same frequency, in this example 1.230 kHz.
It is clear that the ADS1013D does not meet part of the specifications. The measured values of bandwidth, rise time and sampling rate are much worse than specified. The values of the sensitivity (50 mV/div) and the time base (10 ns/div) are in fact too high and too low for a universal oscilloscope to be used for all measuring jobs in the lab.
But, does a hobby technician or student need a bandwidth of 100 MHz and a rise time of 3 ns? No, absolutely not! For the electronics hobbyist who is not willing to spend a few hundred euros on a fully-fledged bench top oscilloscope, the ADS1013D is an excellent alternative that can be used for 95 % of the measurement jobs. Even the service technician who does not want to drag a large and expensive bench top device will appreciate the small size, low price and battery power of this handy oscilloscope.

(Banggood sponsor ad)
DANIU ADS1013D 2 x 100 MHz tablet oscilloscope
The ADS1013D also works very well in this mode, as the oscillogram below shows. The ellipse proves that the two signals have the same frequency, in this example 1.230 kHz.
 |
| Writing of Lissajous curves in X-Y mode. (© 2020 Jos Verstraten) |
Our opinion on the ADS1013D
It is clear that the ADS1013D does not meet part of the specifications. The measured values of bandwidth, rise time and sampling rate are much worse than specified. The values of the sensitivity (50 mV/div) and the time base (10 ns/div) are in fact too high and too low for a universal oscilloscope to be used for all measuring jobs in the lab.
But, does a hobby technician or student need a bandwidth of 100 MHz and a rise time of 3 ns? No, absolutely not! For the electronics hobbyist who is not willing to spend a few hundred euros on a fully-fledged bench top oscilloscope, the ADS1013D is an excellent alternative that can be used for 95 % of the measurement jobs. Even the service technician who does not want to drag a large and expensive bench top device will appreciate the small size, low price and battery power of this handy oscilloscope.
DANIU ADS1013D 2 x 100 MHz tablet oscilloscope