|
For about € 30.00 you can get this nice little gadget, with which you can make the frequency composition of an audio signal visible. You only need to solder the sixteen LED-displays with the necessary care on one of the two PCB's and mount these PCB's on top of each other. |
Introduction to the AK1616 audio spectrum display
What is an audio spectrum display?
Sound consists of all kinds of frequencies in the range between 20 Hz (deep bass) and 20 kHz (inaudible treble for most people). It may be interesting to investigate how the frequencies present in a particular audio signal are distributed over this wide range. You can do this with spectrum analyzers. They divide the entire frequency range into a number of narrow bands and examine how many frequencies in the sound are present in each band. A display shows the instantaneous loudness (the amplitude) in each of these bands.
The AK1616 of Chinese AK Technology divides the frequency spectrum into sixteen bands and indicates the instantaneous amplitude in each band on LED displays containing sixteen segments. In this way, 16 x 16 LEDs give you a good idea of the frequency composition of the sound.
 |
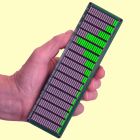
| The fully assembled AK1616 at work. (© Banggood) |
'Building kit' is actually too big a word because most electronics, in the form of tiny SMD parts, are already soldered to the basic PCB. The only thing left to do is soldering sixteen LED displays to the second PCB. By the way, this is a job that requires a lot of patience, a lot of attention and a very fine soldering tip. The solder pads are only 2.05 mm apart and are not much larger than 1.3 mm. A steady hand and the use of very thin solder are therefore absolutely essential attributes.
 |
| A steady hand and the use of a fine soldering tip are absolutely necessary! (© 2020 Jos Verstraten) |
There's nothing to complain about. The AK1616 is delivered in a sturdy cardboard box and the sixteen displays are put on a piece of styrofoam so that the soldering pins remain straight. The two PCBs and the parts are packed in two antistatic plastic bags. However, a manual is missing, you must search the internet for the information to build the circuit and, more important, to operate the device (or read this article).
 |
| The AK1616 is delivered in this way. (© 2020 Jos Verstraten) |
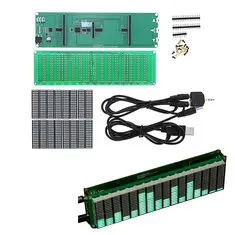
The picture below summarizes what you can expect when you open the two bags. In addition to the two PCBs of 175 mm by 50 mm and the sixteen LED displays are included in the delivery:
- Four spacers and eight screws for mounting the two PCBs.
- Three male PCB connectors to interconnect the two PCBs.
- One USB power cable with a length of 110 cm.
- A stereo cable with a length of 150 cm with 2.5 mm connectors.
- An adapter from 1 x stereo to 2 x mono.
 |
| The contents of the kit. (© 2020 Jos Verstraten) |
The designers of this circuit have divided the audio frequency range from 20 Hz to 20,000 Hz into sixteen bands with the following center frequencies:
32 Hz ~ 64 Hz ~ 96 Hz ~ 128 Hz ~ 160 Hz ~ 192 Hz ~ 256 Hz ~ 320 Hz ~ 480 Hz
640 Hz ~ 800 Hz ~ 1,024 Hz ~ 2,048 Hz ~ 4,096 Hz ~ 8,000 Hz ~ 16,000 Hz.
If you plot these sixteen frequencies on a logarithmic frequency axis, it appears that they are not evenly distributed over this axis. Such an log axis is always used when one wants to measure the behaviour of audio equipment in function of the frequency. The designers should have paid a little more attention to evenly distributing the sixteen center frequencies along the frequency axis.
 |
| The center frequencies plotted on the standard logarithmic frequency axis. (© 2020 Jos Verstraten) |
In the picture below we have identified the most important components on the basic PCB of this audio spectrum display. The two input signals are mixed in an analog input stage, consisting of an op-amp MV358i. The heart of the circuit is of course a microprocessor STM32F. This is a 32 bit RISC processor with two ADCs. It is logical to assume that the analog input signal goes directly to one of these ADCs. The rest of the signal processing can then be done by software in this circuit.
Three ICs are used to control the 16 segments of the 16 displays. The first one, an ICN2012, is in the positive anode supply of the displays. This is in fact nothing more than a 74HC138 3-to-8 decoder, followed by P-channel enhancement mode MOSFET's with an Rds(ON) of only 100 mΩ and a maximum current capacity of 2.5 A. The eight outputs of this IC control the anodes of the displays in eight groups of two.
The cathodes of the displays are pulled to ground via two SUM2017GAS2 16 channel LED drivers with constant current sources. Again, the 16 displays are split into two groups, each controlled by one SUM2017GAS2.
 |
| The electronics on the basic PCB. (© 2020 Jos Verstraten) |
Solder pads are provided on the two narrow sides of the basic PCB for connecting external push buttons (right) and for externally connecting the input voltages and the power supply (left). This is handy if you want to build the AK1616 in a nice housing and therefore need to connect and operate it externally.
The construction of the device
Preliminary remark
As already mentioned, soldering the three connectors and the sixteen displays requires some experience with soldering PCBs with miniature parts. A solder bridge between two adjacent solder pads is easily made and it is not easy to remove such bridges afterwards without damaging the fragile PCB.
Step 1: soldering the three male connectors on the PCB
This connectors must be mounted on the side of the PCB where the white silkscreen contains solely the edge of the connectors and manufacturers name and type number. You must solder these connectors on the side where the displays will be placed later. You must insert the side with the shortest contact pins into the PCB.
 |
| Assembling and soldering the three connectors. (© 2020 Jos Verstraten) |
The displays have only two solder pins on one side and sixteen on the other side. The two pins are internally connected to all anodes of the LEDs. You must mount the displays on the PCB in such a way that the row with two pins ends up on the side where the plus is printed on the silkscreen.
 |
| Assembling and soldering the sixteen displays. (© 2020 Jos Verstraten) |
Mount the four copper spacers on the basic board and then carefully place the display board on the basic board in such a way that all pins of the three male connectors fit into the holes of the female connectors on the basic board. Screw the display board to the spacers.
Using and operating the AK1616
Connecting the AK1616
You can connect the AK1616 to a standard 5 V USB power supply using the supplied power cable. However, the power supply must be able to supply 600 mA current. With the second cable you connect the device to an audio source, for example to the audio output connector of your PC or laptop.
Unfortunately, the device does not have a sensitivity setting. In the final setup you will have to work with an adjustment potentiometer, which you connect in series with the input to adjust the measuring range of the AK1616 to your application.
The three push buttons
The basic PCB has three push buttons on the right side with the indications 'UP', 'OK' and 'DOWN'. By manipulating these three buttons you can set an amazing amount of software functions of this audio spectrum display. Regrettably, the Chinese designers of this kit do not make any effort to properly describe all the functions of their design.
Display test
By pressing the three push buttons together for at least two seconds, all 256 display segments should light up. This way you can check your soldering work. You leave this option by pressing the 'OK' push button for at least two seconds.
Intensity of the display
By pressing the 'UP' or 'DOWN' push buttons for more than one second you can adjust the intensity of the display in 15 steps. During this action you see on the '16000' display the current value of this setting.
Bottom Display ON/OFF (power save mode)
If you start the AK1616 with the factory settings, the lower segments of all channels will light up when there is no signal at the input. This is the so-called 'Bottom Display'. If you press the 'OK' button three times quickly, this baseline will be switched off and only the lower segment of the '32' display will light up when there is no signal at the input. This way you save a lot of power when there is no signal on the input of the AK1616.
Display mode change
By briefly pressing the 'UP' or 'DOWN' push buttons you can scroll through the four available display modes:
- Bar Graph Display
Each display shows the instantaneous amplitude of the signal as a thermometer scale. - Bar Graph Display with Max Hold
The displays hold the maximum value of the signal for a moment in the position of the upper illuminated segment. The speed at which this maximum indication disappears can be set (read on). - Single Dot Display
Only the segment that displays the maximum instantaneous value of the signal lights up. - Dual Dot Display
Only the two segments displaying the maximum instantaneous value of the signal light up.
 |
| The four display modes you can select. (© 2020 Jos Verstraten) |
When you start up the AK1616, the unit operates in the so-called 'Real-out' mode. Clicking the 'OK' button twice will switch to the 'Smoot-out' mode. The sixteen channels in the 'Real-out' mode have a rather narrow bandwidth around the center frequencies. If, in this mode, you put a pure sinusoidal signal with a frequency of 1,024 Hz on the input of the device, only the column '1024' will light up. In the 'Smoot-out' mode, the bandwidth of the filters will increase, so that the columns '800' and '2048' will also light up slightly if you apply a sinusoidal signal of 1,024 Hz.
 |
| The difference between 'Real-out' and 'Smooth-out' mode. (© 2020 Jos Verstraten) |
Pressing the 'UP' and 'DOWN' buttons together for at least two seconds reverses the display. The baseline is moved from the lower to the upper segments of the displays. Pressing both buttons again for two seconds restores the normal position.
Setting the hold speed and fall speed of the display
By pressing the 'OK' button for more than two seconds you can scroll through three speed settings. The type of setting will appear as 'MFT', 'PHT' and 'PFT' on the display after each press of this button. For each setting, the 'UP' and 'DOWN' buttons allow you to set the speed in fifteen steps. The instantaneous value of the speed setting is shown on the '64' display, on the other displays you can see the influence of your chosen speed. By pressing the 'OK' button again for two seconds, you leave this menu.
- MFT
Master Fall Time, the time it takes for the display to fall from the indicated value to zero. - PHT
Peak Hold Time, the time that a peak value (Max Hold) remains on the display if you have selected 'Bar Graph Display with Max Hold' mode. - PFT
Peak Fall Time The speed at which the 'Max Hold' value falls back to zero.
Back to factory settings
All settings you make are stored in the memory of the AK1616 and remain active when you turn on the unit again. Pressing the 'OK' button for more than ten seconds restores the factory settings.
Testing the AK1616 audio spectrum display
The accuracy of the frequencies
The accuracy of the frequencies is excellent. In 'Real-out' mode, only the segments of one display light up when you apply a sinusoidal signal with exactly the center frequency of the respective band.

Measurement of the bandwidth of the '1024' channel
In the 'Real-out' mode we applied a sinusoidal signal with a frequency of exactly 1,024 Hz to the input and regulated the amplitude so that 14 segments of the '1024' display lit up. Afterwards we gradually increased and decreased the frequency of the input signal until fewer segments were lit. When these data are summarized in a graph, you get a good impression of the bandwidth of this band. As the graph below shows, this characteristic of the AK1616 is excellent. The leading and trailing edges of the graph are very steep. Strangely enough, however, the graph is not symmetrical with respect to the center frequency of 1,024 Hz.
 |
| The bandwidth of the '1024' channel. (© 2020 Jos Verstraten) |
Unfortunately the AK16161 has no possibility to set the sensitivity for full scale readout. This specification is not even mentioned anywhere. Of course it is important to know how great that sensitivity is and if it is identical for all bands. Ideally, the sensitivity should not depend on the display that lights up. The full scale sensitivity is, see the table below, 110 mVrms for most bands. However, this parameter does increase somewhat for the five lowest frequency bands.
 |
| The full scale sensitivity of the sixteen bands. (© 2020 Jos Verstraten) |
You see one or more of the sixteen segments light up, but what does this fact mean in practice? That is why we measured the sensitivity per segment at a frequency of 1,024 Hz. Because such data are always displayed in dB, we have converted the data to this magnitude. The reference point was 0.775 Vrms = 0 dB.
 |
| The sensitivity of the individual segments in dB. (© 2020 Jos Verstraten) |
In most practical applications of this spectrum analyzer, a full scale voltage of 110 mV will be too sensitive. Because you cannot set this parameter, there is no other option than to connect a resistor in series with the input. But for that, knowledge of the input resistance of the circuit is of course necessary. We measured this parameter by putting a resistor in series with the input and measuring the voltage drop across this resistor. With Ohm's law, you can then calculate the input resistance of the circuit. This parameter turned out to be 13 kΩ. So if you need to reduce the sensitivity to a full scale voltage of e.g. 775 mV, it is sufficient to connect a potentiometer of 100 kΩ in series with the input and adjust it to about 78.5 kΩ.
Our opinion on the AK1616 audio spectrum display
Of course one can disagree about the usefulness of such a gadget and thirty euros is a lot of money for such a device. But if you need an audio spectrum analyzer or like to stare at all those blinking LEDs, the AK1616 is a good choice. We haven't been able to discover many points of criticism. The only thing the designers could improve is the distribution of the sixteen frequency bands over the full spectrum from 20 Hz to 20 kHz. But in practice the uneven distribution doesn't bother you.
AK1616, LED music audio spectrum indicator