|
With this BGDR, YiCheng Electronics has attempted to bring a complete semiconductor curve tracer to market for only €100.00. Is it a toy or a useful device? We'll leave that up to the reader (M/F) to decide! |
Background information
The Ic = f(Vce) characteristic of a transistor
Various techniques can be used to examine the quality of a bipolar transistor. Measuring the Ic = f(Vce) characteristic is one of the most thorough. This characteristic can be compared to an ‘ECG’ of your heart. Just as an ECG provides a lot of information about the condition of your heart, the Ic = f(Vce) characteristic provides a lot of information about the condition of a transistor. For example, you can derive the amplification factor β from it, as well as the dynamic resistance and the knee voltage of the semiconductor. This characteristic is also used to set the transistor stage. In short, the Ic = f(Vce) characteristic is, as it were, the passport photo of a bipolar transistor. If a transistor has a good characteristic, you can be sure that this semiconductor is working properly.
Note
This characteristic is also referred to as the ‘output characteristic’ of the semiconductor.
What is the Ic = f(Vce) characteristic?
The Ic = f(Vce) characteristic shows the relationship between the voltage between the collector and the emitter Vce and the magnitude of the collector current Ic of a bipolar transistor. However, this characteristic is largely dependent on the base current that you send into the transistor. For each value of the base current, you can record your own output characteristic. This results in a set of curves that is unique to the transistor.
 characteristic of a transistor.") |
| A good Ic = f(Vce) characteristic of a transistor. (© 2026 Jos Verstraten) |
Measuring the output characteristics
How is such a set of curves created? You send a certain constant current Ib into the base. You then vary the collector/emitter voltage Vce step by step from zero to maximum and note the flowing collector current Ic for each value. You repeat these measurements with double the base current and continue in this way until you have recorded the entire set of curves.
How does a curve tracer work?
Manually recording this output characteristic is a time-consuming task, but with some simple electronics, you can do it in a second. A curve tracer displays the Ic = f(Vce) characteristic on the screen of your analog or digital oscilloscope. If that bundle of graphs looks good, you know you can use the transistor in new circuits without any problems.
The figure below reveals how this can be achieved electronically. An oscillator controls a step voltage generator on the one hand and a sawtooth voltage generator on the other. Each time a sawtooth cycle is completed, the step voltage is increased by one step.
 |
| The block diagram of a semiconductor curve tracer. (© 2026 Jos Verstraten) |
After a certain number of steps, the staircase collapses and the process starts again. The sawtooth is used as Vce and the staircase voltage sends a current Ib into the base. Your oscilloscope requires you to feed it with Vce and Ic. You measure the Vce between the collector and the ground. Of course, the collector current cannot be measured directly. But don't worry, that current also flows through the small resistor Rc. The voltage across this resistor is directly proportional to the collector current and can be fed to the vertical deflection of your oscilloscope via a differential amplifier.
Your oscilloscope must be in X/Y mode!
This trick only works if your two-channel oscilloscope has a so-called ‘X/Y mode’. In this mode, the time base, which normally determines the horizontal scale, is switched off and the second channel can be used for this function. You must then control this channel with the output voltage of the curve tracer, which is directly proportional to the collector/emitter voltage.
More applications
In addition to measuring the output characteristics, you can do even more with a curve tracer. You can also use it to measure the input characteristics, which give the relationship between the base/emitter voltage Vbe and the base current Ib. You can then immediately see, for example, whether you are dealing with a normal transistor or a darlington.
You can also display the current/voltage characteristics of all kinds of diodes on the screen of your oscilloscope.
Introduction to the BGDR curve tracer
A complete curve tracer in one inexpensive device
The unique feature of the BGDR curve tracer from YiCheng Electronics is that the device has an LCD display on which the characteristics are written. This means you do not need an external oscilloscope. As far as we know, the BGDR is the cheapest complete curve tracer you can find.
Suppliers and prices
The BGDR curve tracer was developed by YiCheng Electronics. However, no information about this company can be found on the internet. The device is sold by various suppliers via AliExpress. The cheapest is the ‘eTool Store’, which sells it for € 106.00. You can also buy the BGDR curve tracer on eBay, although the prices there are considerably higher.
The appearance of the BGDR curvetracer
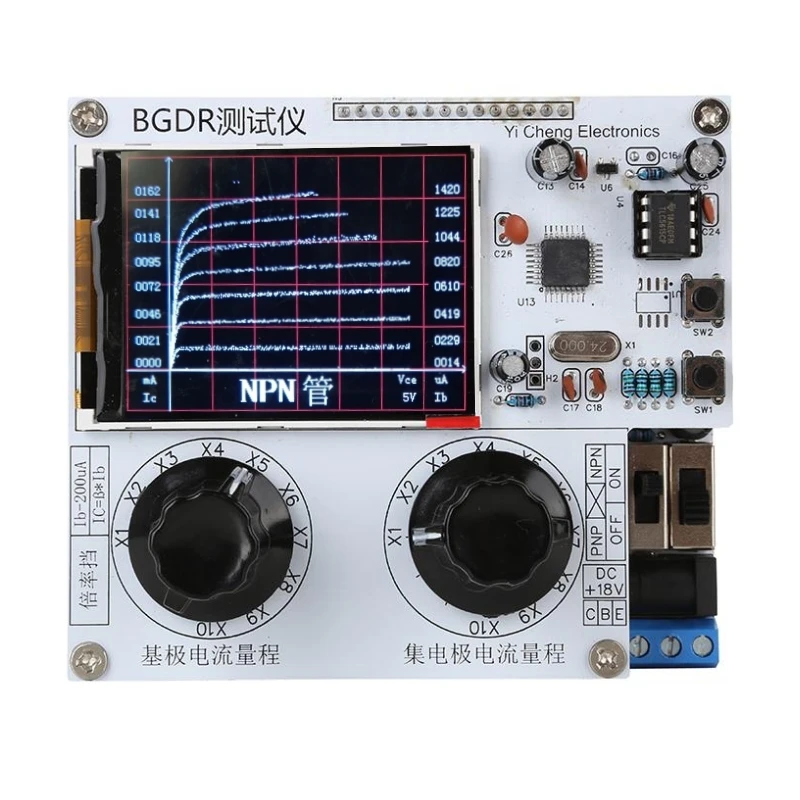
As the photo below shows, for your hundred euros you do not get a complete device, but only two printed circuit boards that you can assemble yourself in a housing if you wish. The printed circuit boards measure 88 mm by 100 mm and are connected to each other by fourteen wires. The lower circuit board has a standard power connector, to which you must connect a power supply of 18 Vdc. There are also two slide switches. The first switch turns the device on and off, while the second switch allows you to select NPN or PNP transistors. Under the power connector is a three-pin screw terminal block to which you must connect the base, emitter, and collector of the transistor to be tested.
The upper circuit board features a 40 mm by 52 mm LCD display and two rotary switches with ten positions. The left switch selects the base current, while the right switch selects the collector resistance and thus also the collector current. There are two small push buttons on the right. The upper SW2 activates the menu, while the lower SW1 selects an option from this menu and starts a measurement cycle.
A piece of this circuit board is missing at the bottom right, so that it is possible to operate and connect the switches and the PCB terminal block on the lower circuit board.
The total height, including the switch buttons, is 48 mm.
 |
| The BGDR curve tracer from YiCheng-Electronics. (© AliExpress) |
The manual
This is not included, but we have compiled the basic specifications and instructions for use the device from the various product pages on AliExpress and eBay.
The specifications of the BGDR curvetracer
The suppliers provide very basic specifications:
- Supply voltage: 18 Vdc ~ 1 A
- Base current: 20 μA/step ~ 200 μA/step in 10 steps
- Collector current: 150 mA dynamic max.
- Collector resistance: 10 steps
- Display: 2.4 inch TFT, 240 by 320 pixels
- Horizontal scale: 1.0 V/div
- Image build-up time: 440 ms
- Dimensions: 88 mm x 100 mm x 48 mm
- Weight: 192 g
The electronics of the BGDR curve tracer
The power supply
The external power supply voltage of 18 Vdc is converted internally into:
+5.0 V for the digital electronics
+3.3 V for the LCD screen
+5.8 V for the LCD backlight
±9.0 V for the analog electronics
This requires a lot of electronics, which can be found on the bottom circuit board.
The bottom circuit board
The photo below shows the bottom circuit board. In addition to the power supply, it contains the analog electronics that provide the signals needed to generate the timing and collector voltage. This circuit board contains ten transistors and five ICs:
- 2 x TL074N: quad op-amp.
- 1 x LM324N: quad op-amp.
- 1 x LM393N: dual comparator.
- 1 x MP1584: buck converter, which is undoubtedly used in the power supply.
On the bottom of the board, on the left is the rotary switch with which you set the base current and on the right is an identical switch with which you select the resistance in the collector circuit. Both rotary switches are of excellent quality.
 |
| The bottom circuit board of the curve tracer. (© 2026 Jos Verstraten) |
The upper circuit board
This contains only two ICs:
- 1 x TLC5615CP: 10 bit D/A converter
- 1 x microprocessor: the type number has been lasered off.
It is obvious that the D/A converter is used to generate the staircase voltage that is supplied to the base via a resistor.
The circuit board also contains some Chinese lettering near the two rotary switches. In the photo below, we have replaced this illegible text with the commonly used English texts.
 |
| The upper circuit board of the curve tracer. (© 2026 Jos Verstraten) |
The output signals
The signals at the B and C connections relative to the E connection, when measuring the output characteristics of an NPN transistor, are shown in the figure below. Please note that the measurements were taken without a transistor connected!
You will notice that the stepped voltage used to control the base is only 1.5 V at most. This is not a problem with bipolar transistors, because that voltage is high enough to open the transistor and generate base current. However, that low voltage does become a problem when testing enhanced N-channel MOSFETs. The gate of such a semiconductor requires a bit more voltage!
By setting the switch that determines the base current to the highest position, the maximum voltage at output B is increased to approximately 5 V, but then most of the steps in the staircase reach this limit. Far fewer traces are then written. That 5 V is probably just high enough to test something with MOSFETs (read on).
 and C/E (yellow) voltages in NPN measurements.") |
| The B/E (blue) and C/E (yellow) voltages in NPN measurements. (© 2026 Jos Verstraten) |
Working with the BGDR curve tracer
Startup
After connecting the 18 Vdc power supply and setting the ON/OFF switch to the correct position, the screen below appears on the display.
 |
| The welcome screen on the display. (© 2026 Jos Verstraten) |
Open the menu
Next, press and hold the SW2 button until the menu below appears on the display. Here you will see the five operating modes of the device:
- Output characteristic of NPN transistors
- Output characteristic of PNP transistors
- Input characteristic of NPN transistors
- Input characteristics of PNP transistors
- I/U characteristics of diodes
Press the SW1 button briefly to select the desired measurement function. Is the arrow next to the desired function? Then press and hold the same button until the menu disappears and you enter the selected measurement function.
 |
| The menu selection. (© 2026 Jos Verstraten) |
The output characteristic Ic = f(Vce) of NPN transistors
As an example, we will discuss two old, reliable transistors: a BC107B and a 2N3055. Select the correct menu option, set the slide switch to the ‘NPN’ position, connect the transistor, and briefly press the SW1 push button. The BGDR curve tracer will now write one set of curves on the display. Please note that this is a one-time action and the image is static. The image will freeze on the display. If you want to write a new set, for example after changing the settings of the two rotary switches, you will need to press the push button again.
You will need to experiment with the settings of both rotary switches to obtain the best representation of the output characteristics on the screen. For example, the image below shows the Ic = f(Vce) bundle of a BC107B. Note that the horizontal axis only goes up to 5 V. This is logical, given the low supply voltages of ±9 V for the internal circuits.
 of a BC107.") |
| The Ic = f(Vce) of a BC107. (© 2026 Jos Verstraten) |
Note the two scales on the left and right of the image. These indicate the values of the collector and base currents. Using these figures, you can easily calculate the amplification factor β of the semiconductor:
β = Ic / Ib
In the example shown, a collector current of 98 mA is generated by a base current of 1.416 μA. The measured current gain is then:
β = 98 / 1.416
β = 70
That is an absurdly low value for a BC107B. According to the specifications, this value should be between 200 and 450. Our Voltcraft TT100 static semiconductor tester gives a realistic HFE value of 269 for this semiconductor. Of course, β and HFE are not identical; β is the alternating current gain and HFE is the direct current gain. However, in most cases, the two values do not differ greatly. These widely varying measurement results cause us to doubt the accuracy of the current values shown on the display.
Moreover, dividing the other Ic's by the other Ib's yields completely different values, which only increases our distrust.
The second example shows the characteristics of a 2N3055 power transistor. This transistor appears to be in excellent condition, at least according to this device. A base current of 1 mA generates a collector current of 105 mA, resulting in a β of 105. However, according to the specifications, β for this transistor is between 20 and 70. The TT100 provides a value for HFE of 79.
 of a 2N3055.") |
| The Ic = f(Vce) of a 2N3055. (© 2026 Jos Verstraten) |
The output characteristic Ic = f(Vce) of PNP transistors
We will use the BC177 as an example. Not only do you have to select a different menu option, but you also have to set the slide switch on the lower circuit board to the other position. The result is shown in the figure below.

According to the data on the screen, β has a value of 65, which is not very plausible. The TT100 also disagrees with this, measuring an HFE of 308, a value that is certainly more credible. So once again, we have serious doubts about the accuracy of the measurement with the BGDR curve tracer!
 of a BC177.") |
| The Ic = f(Vce) of a BC177. (© 2026 Jos Verstraten) |
The input characteristic Ib = f(Vbe) of an NPN transistor
This characteristic shows the relationship between the base current and the voltage between the base and the emitter. Again, we will use a BC107 as an example. The graph below shows that the base/emitter voltage is approximately equal to 0.7 V, the normal value for a bipolar silicon transistor. If you measure a voltage of approximately 1.3 V here, you know that you are dealing with a darlington transistor.
 of an NPN transistor.") |
| The Ib = f(Vbe) of an NPN transistor. (© 2026 Jos Verstraten) |
Measuring diodes
We select the last option from the menu and connect various diodes between E and C. The anode is connected to C and the cathode to E. According to the information on the internet, the scales are then adjusted to:
- Horizontal: 1 V/div
- Vertical: 40 mA/div
First, we test a silicon diode 1N4148. The result is shown in the photo below. The current/voltage characteristic is neatly written with a voltage across the conductive diode of approximately 0.65 V.
 |
| A 1N4148 on the curve tracer. (© 2026 Jos Verstraten) |
Next, a blue LED is connected. Again, the characteristic is neatly displayed.
 |
| The characteristic of a blue LED. (© 2026 Jos Verstraten) |
Finally, we test a zener diode. Because the horizontal scale only goes up to 5 V, we are rather limited. We choose a 3V9 model; you can see the result in the photo below. It is not clear why the characteristic now stops at just under 60 mA. We also notice a few scatter points around the curve that do not belong there.
 |
| The characteristic of a 3V9 Zener diode. (© 2026 Jos Verstraten) |
Testing MOSFETs
In modern times, bipolar power transistors are often replaced by MOSFETs. The question is whether such components can also be tested with this BGDR curve tracer. In fact, only enhanced N- and P-channel MOSFETs are suitable, because in terms of polarities, they are controlled in the same way as NPN and PNP transistors. The problem, however, is that this curve tracer delivers a maximum voltage of 5.0 V at the B output, and only in the highest position of the base current switch. This is far too low to display an Id = f(Vds) curve. For an IFR3205, the minimum voltage between gate and source is 4.5 V, as shown in the graph below.
 |
| The output characteristic of an IRF3205 MOSFET. (© International Rectifier) |
This is also evident when we connect such a MOSFET to the BGDR curve tracer for testing. We only get the beginning of the lower graph on the display. For some reason, no current values are displayed.
 |
| The IRF3205 on the BGDR curve tracer. (© 2026 Jos Verstraten) |
Our opinion on the BGDR curve tracer
We have very mixed feelings about this measuring device. A curve tracer is a popular addition to anyone's hobby lab, as evidenced by the many topics on this subject on various electronics forums. However, all of the inexpensive devices discussed on those forums require an external oscilloscope. This BGDR curve tracer from YiCheng Electronics does not require one, which is definitely a breakthrough, considering the price of one hundred euros. But is this device worth one hundred euros?
The BGDR curve tracer certainly displays beautiful curves, making it useful for quickly determining whether a bipolar transistor or diode is usable or not. However, in our opinion, the numerical data that appears on the screen is completely unreliable. This curve tracer is therefore not suitable as a serious measuring instrument.
We leave it up to the reader (M/F) to decide whether it is a toy or a useful device, as we asked in the introduction to this article. We usually sell tested products for half the price. After all, we are not collectors of things and we can use the money to purchase new products to test. However, we are keeping this curve tracer, because we think it is a fun gadget to use occasionally for testing transistors used in experimental circuits.

BGDR curvetracer