|
Rigol's DS1102E, with its bandwidth of 100 MHz, its sampling rate of 1 GSa/s, its two channels and its price of around EUR 350.00, is a typical representative of the modern generation of medium-priced digital oscilloscopes. In this article an overview of what you can expect from this oscilloscope. |
Introduction to Rigol's DS1102E
The appearance of this oscilloscope
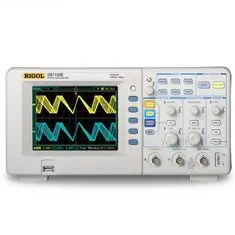
With dimensions of 303 mm by 154 mm by 133 mm and a weight of 2.4 kg, the DS1102E is a handy device that you can easily take with you wherever you go. Not very handy is the fact that the 230 V mains connector is located on the left side and the mains switch on the top of the housing. On the back you will find three connectors with which the device can communicate with the outside world: a USB connector, a serial bus and a via an optical coupler isolated BNC connector. Inside the device there is an unfortunately rather noisy fan that cools the processor and other electronics. The colour screen works with TFT-LCD technology and has a diagonal size of 145 mm.
 |
| The appearance of the DS1102E from Rigol. (© Rigol) |
On the front panel you will recognize the controls you find on each digital scope. In the figure below we have provided all buttons with their exact function. What is striking about this oscilloscope is that the settings for the two input channels are combined. You only have one dial available for setting the sensitivity and one potentiometer for moving the image vertically. You have to press one of the buttons 'CH1' or 'CH2' briefly to make it clear to the device which channel you want to set.
All buttons also have a dual function. You can, of course, turn them to change the value of a parameter. But you can also press it. With most buttons, this restores the basic setting. For example, if you press the 'POSITION' button of the vertical settings, the zero level of the channel in question will be set again in the middle of the screen.
The 'SCALE' button for setting the sensitivity has a special dual function. Normally you set the sensitivity according to the known 1-2-5 sequence. However, if you press this button briefly, you can set the sensitivity of both channels per 20 mV and, if you keep on turning, per 50 mV. Pressing the 'SCALE' button on the time base immediately activates the delayed time base, see later.
 |
| The controls of Rigol's DS1102E. (© 2020 Jos Verstraten) |
The data that appear on the screen by default is shown in the figure below. The two channels are shown in blue and yellow. These colors are also shown on the two BNC input-connectors. A third channel, written on the screen for some mathematical functions, is shown in purple. A reference signal that you can store in memory and recall appears in white.
 |
| The default data on the screen. (© 2020 Jos Verstraten) |
If you press the 'AUTO' button or one of the buttons in the 'MENU' field, the relevant menu appears on the screen. The various menu options are aligned with the five buttons on the right-hand side of the screen. So you immediately see which of the five buttons you can use to operate a menu function. Sometimes you will see a large arrow with '1/2' or '1/3' at the bottom of the menu. This means that the menu contains two or three pages that you can open with the lower menu button. In the default settings, the menu remains on the screen until you press the small, white 'MENU ON/OFF' button. In the 'Display' menu, you can change this option so that the menu disappears from the screen after an adjustable time.
 |
| One of the menus shown on the screen. (© 2020 Jos Verstraten) |
The housing of the DS1102E consists of two parts made of plastic. Nice and cheap, of course. However, this raises the question of electromagnetic radiation, which such a device emits without any doubt. Unfortunately, it is impossible to open the housing, at least in this case of this review specimen that after the review must be returned undamaged to the supplier (the life of a reviewer is hard!). Fortunately, the service manual, which could be traced via Google, gives a clear answer. After removing the plastic housing, it turns out that the entire electronics are enclosed in a nice metal cage that is earthed via the mains plug. So the chance of electromagnetic interference coming out of the scope is minimized.
 |
| The metal cage underneath the plastic housing. (© Rigol) |
The specifications of the Rigol DS1102E
Vertical specifications
- Input coupling: AC, DC, GND
- Input impedance: 1 MΩ, 15 pF
- Maximum input voltage: 400 V
- Probe compensation: attenuation 1x, 5x, 10x, 50x, 100x, 500x, 1,000x
- Sensitivity: 2 mV/div to 10 V/div (1-2-5 sequence)
- Fine control: 20 or 50 mV/step
- Analogue bandwidth: 5 Hz to 100 MHz
- Bandwidth limitation: 20 MHz
- Rise time: less than 7.0 ns
- Time delay between the two channels: 500 ps typical
Time base specifications
- Sampling speed real time: 1 GSa/s
- Sampling resolution: 8 bit
- Sampling speed at equivalent sampling: 25 GSa/s (not always available)
- Interpolation algorithm: Sin(x)/x
- Memory range: 16,000 samples up to 1,000,000 samples
- Time base: 2 ns/div to 50 s/div (1-2-5 sequence)
Trigger specifications
- Internal sensitivity: 0.1 div to 1.0 div
- External sensitivity: ±1.2 V
- Hold-off range: 100 ns to 1.5 s
- Triggering on edge: rising, falling, rising and falling
- Pulse width setting: 20 ns to 10 s
- Triggering on pulse that is: greater than, less than or equal to set width
- Video triggering: NTSC, PAL, SECAM
Numerical measurement
- Number of cursors: 2 x voltage, 2 x time
- Measurements: voltage, time, voltage difference, time difference
- Voltage: Vpp, Vamp, Vmax, Vmin, Vtop, Vbase, Vavg, Vrms, Vovershoot, Vpreshoot
- Time: frequency, period, rise time, fall time, +width, ±delay between channels
General specifications
- Screen: 5.7 inch TFT-LCD, multicolor
- Resolution: 320 x 234 pixels
- Number of colors: 64,000
- Probe compensation: 1 kHz, 3 Vpeak-to-peak
- Mains voltage: 100 Vac to 240 Vac, 45 Hz to 440 Hz
- Power: less than 50 W
- Dimensions: 303 mm x 154 mm x 133 mm
- Weight: 2.4 kg
Resolution only eight bit
The DS1102E works with an ADC with a resolution of eight bits. What is immediately noticeable is the digital quantification noise present on the signal. The screen image is composed of the famous 'stepped approach' to the analog input voltage. This phenomenon, inherent to digitizing any analog signal, is clearly noticeable in the screen dump below, where we have increased both the horizontal sensitivity and the time base speed to make the individual quantification steps clearly visible.
 |
| The quantization noise present on the signal is a consequence of the 8 bit ADC. (© 2020 Jos Verstraten) |
Standard measurements with the DS1102E
Measure two correlated signals
In most cases, you will measure two signals that come from one and the same circuit and therefore have a time relationship with each other. This is called 'correlated'. Working with the DS1102E is then extremely simple. Just connect the two signals to the two inputs and press the 'AUTO' button. You will hear relays click for a few seconds and then the image below appears on the scope, with a menu with a number of choices. You can choose between 'Multi-cycle' or 'Single-cycle'. In the first case, the scope sets the time base so that five periods of the signal appear on the screen. In the second case, you will only see one period. With 'Rise Edge' or 'Fall Edge' you can choose whether the scope triggers on the rising or falling edge.
 |
| The DS1102E has evaluated the two input signals and offers you a few choices. (© 2020 Jos Verstraten) |
Maybe you want to know exactly what the effective value of the signals is or you need to know the exact frequency. You can put three numeric values on the screen. Press the 'Measure' button. In the menu you can make the following choices:
- Source: channel 1 or channel 2
- Voltage: Vpp, Vamp, Vmax, Vmin, Vtop, Vbase, Vavg, Vrms, Vovershoot, Vpreshoot
- Time: Period, Freq, Rise Time, Fall Time, +Width, -Width, +Duty, Delay1-2Rise, Delay1-2Fall
You select by turning the white 'Multifunction' button to the left of the menu buttons and confirm by pressing this button. Don't you understand what all the parameters mean? Don't worry, the scope puts small icons in the menus so you immediately understand what is being measured. In the example below we have displayed the peak-to-peak voltage of both channels and the frequency of channel 2 on the screen.
 |
| With these icons the DS1102E makes clear what is being measured. (© 2020 Jos Verstraten) |
 |
| You can display three numerical values of the signals on the screen. (© 2020 Jos Verstraten) |
Measure all data of one of the signals
In the same menu you will see the option 'Display All'. If you activate this option, the scope quickly calculates all eighteen variables and puts their numerical values in a table on the screen, below the signal that is being measured.
 |
| Could it be too much information? Perhaps, if the oscilloscope calculates eighteen numeric data. (© 2020 Jos Verstraten) |
Two oscilloscopes in one device
Alternate triggering
If you want to measure two uncorrelated signals, most scopes have a problem. After all, you only have one time base rate and you can only trigger on either channel 1 or channel 2, with the result that one of the two inputs does not give a still image. With the DS1102E, however, you can make the two channels work completely independently of each other, so each with its own time base speed and trigger level.

How to proceed
Connect the two uncorrelated signals to the two inputs. Press the 'MENU' button of the trigger functions and select the 'Mode' function. You will see a menu with 'Alternate' as the lower choice. After selecting this option with the white 'Multifunction' button and confirming your choice by briefly pressing this button, the two signals will appear on the screen in a stable way. By briefly pressing 'CH1' or 'CH2' you can adjust the sensitivity, the time base speed and the trigger conditions of both channels completely independently of each other. Under each signal you will see the corresponding time base setting. Two independent scopes in one device!
 |
| Two non-correlated signals stable on one screen. (© 2020 Jos Verstraten) |
Measuring with Delayed Scan
Ideal for observing narrow pulses
Analog oscilloscopes of the better quality have the function 'Delayed Timebase'. This allows you to enlarge a small part of the oscillogram, that part appears as a new oscillogram below the regular oscillogram. An ideal function for observing narrow pulses with low frequency. The DS1102E also has such a function, which is easy to recall and which is called 'Delayed Scan'.
How it works
Put the signal on one of the two channels and set the time base so that you see at least one of the narrow pulses on the screen. Now press the 'SCALE' button of the horizontal setting. The image is immediately split into two oscillograms. You will see a window appear in the top oscillogram. You can set the width of this window with the 'SCALE' button and move the window with the 'POSITION' button.
 |
| Magnifying a narrow signal with the Delayed Scan function. (© 2020 Jos Verstraten) |
Enabling the mathematical functions
Powerful function behind the 'MATH' button
After pressing the 'MATH' button, the math menu appears on your screen. You will not often feel the need to add, subtract or multiply both channels. However, the lower selection 'FFT' is interesting. Under this option a spectrum analyzer is hidden, which gives you an overview of the frequency composition of the input signal at the push of a button.
Some theory about FFT
FFT stands for 'Fast Fourier Transform'. It is a mathematical algorithm that can derive the frequency composition of a signal from successive samples of a periodic signal. The French mathematician Fourier discovered in 1822 that all periodic signals are composed of the sum of a series of sine waves with frequencies that are multiples of the frequency of the signal. These sine waves are called the harmonics of the signal. So a square wave with a frequency of 1 kHz consists of sinusoidal signals with frequencies of 1 kHz, 2 kHz, 3 kHz, etc. to infinity. However, the amplitude of the sine waves gets smaller and smaller, so in practice one usually only calculates up to the twentieth harmonic. This theory has important applications in electronics, for example in the synthesis of the sounds of musical instruments. The fact that a piano key with a frequency of 440 Hz sounds very different from a violin string with a frequency of 440 Hz has everything to do with the different harmonic composition of these tones. Fourier's theory also explains why modulated HF signals transmitted by cable are a certain frequency distance apart. If the carrier waves were placed too close together, the harmonics could interfere with each other, affecting the integrity of the signals.
Working with FFT on the DS1102E
Put a square wave with a duty-cycle of exactly 50% on one of the inputs and call up the FFT function using the 'MATH' button. The screen immediately splits into two oscillograms. The upper one shows the shape of the input signal, the lower one shows the frequency composition of this signal. Of course you can use the vertical and horizontal settings to make the Fourier analysis as accurate as possible.
 |
| The Fourier analysis of a square wave gives the expected result. (© 2020 Jos Verstraten) |
Working with the cursors
Two vertical and two horizontal cursors
The 'Cursor' menu button allows you to display two horizontal and two vertical cursors. Of course you use the horizontal one to measure voltages and the vertical one to measure times. However, you can only measure either vertically or horizontally.
Measuring the peak-to-peak value of a voltage
In the example below, we measured the peak-to-peak value of a pulse by setting the two horizontal cursors. You choose 'Mode Manual', 'Type Y', 'Source CH1' and you can then set the two lines by successively selecting 'CurA' and 'CurB' using the white 'Multifunction' button. The measured values appear on the top right of the screen, as well as the calculated voltage difference delta-V (ΔV).
 |
| Measuring the peak-to-peak voltage of a pulse with the horizontal cursors. (© 2020 Jos Verstraten) |
Exporting the oscillograms
Connecting to the PC
Rigol provides Windows software that allows the DS1102E to work together with your PC. With this software 'UltraScope' you can save the oscillograms as .BMP files or read the samples as .TXT files for further processing in analysis software. Of course, you can also print the oscillograms.
Saving to a USB stick
However, saving data is much easier by plugging a USB stick into the USB connector below the screen. An icon lights up on the screen and the 'Storage' menu allows you to save the full screen content, button settings and the numerical value of the samples.
Take a screenshot
Probably you most often need to store the entire screen, for example as an illustration of a report or for publication on a blog. All screenshots in this article are made this way. Open the 'Storage' menu and select 'Storage Bip Map', 'Para Save OFF' and 'External'. With the option 'Invert' you can convert the black background of the screen to a white background. In the following menu, you can assign a name to the screenshot. You can operate the keyboard with the white 'Multifunction'-button. After clicking the 'Save' button, the entire screen will be saved as a .BMP file to the USB stick. You can then plug the stick into your PC and use any graphics software to make the .BMP files visible, convert them to the more common .JPG format and print them out. The resolution of the screenshots is equal to the resolution of the screen, i.e. 320 x 234 pixels.
 |
| In this menu you can assign a name to a screenshot on the USB stick. (© Rigol) |
Other Functions
The DS1102E has even more to offer
Have we now discussed all the features and capabilities of the DS1102E? Absolutely not! So at the end of this article an overview of the other functions, which you will probably seldom use.
- Probe Compensator:
Next to the trigger input is a connector where a 1 kHz square wave is available for adjusting the trimmer capacitor in 1/10 probes. - Trigger Holdoff:
An adjustable delay between the trigger moment and the moment the scope starts to sample. Is interesting when observing complexly shaped signals. - BW Limit:
An option that limits the analog bandwidth to 20 MHz, suitable for suppressing HF noise. - Digital Filter:
An option that allows you to digitally limit bandwidth to low-pass, band-pass or high-pass. The white 'Multifunction' button allows you to set the frequencies. - Ref Waveform:
You can save an oscillogram to a non-volatile memory and later display it as a reference, so you can compare a new oscillogram with this reference. The reference is displayed in white. - X-Y Mode:
The time base is switched off and CH2 is used for the vertical axis of the screen. Ideal for writing Lissajous figures to study the phase and frequency relationship between the two signals.
 |
| Comparison of the frequencies of two signals in X-Y Mode. (© 2020 Jos Verstraten) |
- Pulse Width Trigger:
Setting of the width of a trigger pulse, with selections smaller than, greater than, equal to, for both positive and negative pulses. - Averaged Sampling:
The samples written on the screen are the average values of 2 to 256 measured samples. Ideal for separating small signals and noise. - Equivalent Sampling:
A software algorithm that can only be used with very stable periodic signals and that increases the virtual sampling rate to 25 Gsa/s. - Vector Display:
A software algorithm in which the successive dots on the screen, each representing a sample, are connected with small vectors creating a continuous oscillogram. Recommended! - Grid:
Selection between various image grids. - Internal Store:
Up to ten screenshots and settings can be stored in an internal non-volatile memory and recalled at any time. Non-volatile means that the memory content is retained even if the scope is switched off. - I/O SETUP:
Setting the RS-232 and GPIB communication parameters. - Waveform Recorder:
Makes a video of one of the channels, with a maximum number of 1,000 frames. The interval between two frames is adjustable between 1 ms and 1,000 s. This video can be played back afterwards. - Pass/Fail:
You create a mask around one of the signals. Afterwards, each input signal is compared to this mask. This way you can immediately see if a new measurement is equal to the reference measurement. In the example below, the new measurement is well outside the tolerances of the reference measurement mask.
 |
| The performance of the Pass/Fail function. (© 2020 Jos Verstraten) |

Rigol DS1102E 2x100MHz oscilloscope