|
With its price of about € 25.00, its bandwidth of 200 kHz, its sensitivity of 5 mV/div and its time base to 10 µs/div, the DSO150 is a nice scope for anyone who starts out with electronics as a hobby. |
Introduction to the DSO150
The presentation of the DSO150
The DSO150 is available as a kit and as a ready-to-use device. The price difference is approximately € 8.00. We ordered the ready-to-use device from a Chinese supplier for € 25.88. The DSO150 comes in a sturdy cardboard box that protects the contents sufficiently against all the calamities that a package travelling from China to the Netherlands can encounter. In the box is the oscilloscope itself, an 80 cm long cable from BNC to 2 x 4 mm banana plug and an English manual.
 |
| The ready-to-use DSO150 package. (© 2018 Jos Verstraten) |
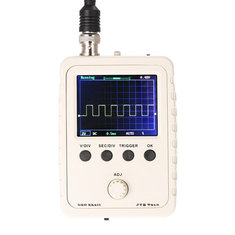
The oscilloscope is housed in a plastic box of 10.0 cm x 7.5 cm x 2.2 cm, weighs only 84 grams and is therefore easy to handle. The front is dominated by the 5.1 cm x 4.0 cm screen. Below are push buttons with which you can select the three main functions sensitivity, time base and trigger. Below this is a rotary encoder with a push button, with which you can set the selected function numerically. On the bottom side is a switch for switching the scope on or off and a standard 5.5 mm / 2.1 mm power connector. Here you can connect a power supply that can deliver a stabilized DC voltage of 9.0 V. The supply voltage is rather critical and should not be lower than 8.0 V and absolutely not higher than 10.0 V. On the top side you see the BNC connector for the input signal, the AC/DC/GND selector and a contact with the usual rectangle voltage for capacitive compensation of 1/10 measuring probes.
 |
| The controls of the DSO150. (© 2018 Jos Verstraten) |
The electronics of each DSO (digital sampling oscilloscope) contains two large blocks. An analog block that is responsible for amplifying or attenuating the input signal and controls the AC or DC coupling of this signal. A digital block that converts the processed analogue signal into a large series of digital samples and makes these samples visible on the display. This block also contains the microprocessor that controls everything.
In the DSO150, these two blocks are housed on two separate boards, see photo below. The analogue PCB is mounted on the bottom side of the housing, the digital PCB on the top side. Both PCBs are connected to each other by means of connectors.
If you buy the kit version of the DSO150 you only need to mount the analog board. The digital PCB, full of SMD components, is delivered fully assembled and tested.
 |
| The position of the two PCBs in the housing. (© 2018 Jos Verstraten) |
The digital part of the wiring diagram is not very interesting. The details of the design are rather in the software than in the hardware. The only thing to mention about this is that a STM32F103C8 microcontroller is used. More interesting is the analog part of the electronics shown in the figure below.
First of all the power supply. Previous versions of the DSO150 were rather unstable because of the lack of good stabilization of the internal power supply voltages. In the new version this problem has been solved. From the external supply voltage of 9.0 V two stable supply voltages of +5 V and -5 V are generated to supply the analog circuits by means of an ICL7600, a 78L05 and a 79L05. The input signal is offered to two parallel-connected buffers around two TL085 op amps. These have capacitively compensated attenuators at the input, respectively R1/R2 and R3/R4. The outputs of these op-amps go to a 74HC4053 analog switch. Which op-amp is selected is determined by the processor signal SENSEL3. This is followed by a simple non-inverting amplifier around a third TL084. The output of this op-amp is terminated with a very low impedance resistive voltage divider R7 to R12. The nodes of this divider are connected to the analog inputs of a second analog switch 74HC4051.
This is an eight channel analog multiplexer. Te processor signals SENSEL0, SENSEL1 and SENSEL2 determine which node of the resistor divider is processed. Finally, the attenuated input signal is offered to an amplifier around a fourth TL084. Here the signal to be digitized is superimposed on a DC voltage, so that a signal level of 0 V corresponds to a voltage of +1 V.
 |
| The schematic of the analog signal processing. (© JYE Tech) |
- Number of channels: 1
- Analog bandwidth: DC ~ 200 kHz
- Sensitivity: 5 mV/div ~ 20 V/div in 1-2-5 steps
- Sensitivity accuracy: 5 %.
- Input impedance: 1 MΩ
- Maximum input voltage: 100 V peak-to-peak
- Coupling: DC, AC, GND
- Resolution: 12 bit
- Real-time sampling rate: 1 Ms/s max.
- Time base: 10 μs/div ~ 500 s/div in 1-2-5 steps
- Memory size: 1,024 samples
- Trigger modes: Auto, Normal, Single
- Trigger type: increasing/decreasing flank
- Trigger position: in half of the memory
- Display type: 2.4 inch color TFT-LCD
- Display resolution: 320 x 240 pixels
- Supply voltage: 9.0 Vdc
- Supply current: 120 mA typical
- Dimensions: 115 mm x 75 mm x 22 mm
- Weight: 100 grams
Working with the DSO150
The operation of the scope
The operation is extremely user-friendly. Press once on the push buttons V/DIV, SEC/DIV or TRIGGER and you can use the rotary encoder to set the value of this option. Press the button a second time and you can use the rotary encoder to adjust the screen position of the option. An example. Suppose you have to set the input sensitivity to 2 V/div. Press the V/DIV button. A blue rectangle appears around the sensitivity indicator on the screen. Turn the rotary encoder until the display shows 2 V/div. Press the V/DIV button a second time. You can now use the rotary encoder to set the zero line over the full height of the screen. In the same way you can set the time base and the trigger.

Numeric data on the screen
Press the OK button for at least three seconds. A lot of numeric data of the measured signal appears on the screen, such as the frequency, the period, the RMS value and the duty cycle of the signal. By pressing the OK button again, this data disappears.
 |
| The numeric data of the signal on the screen. (© 2018 Jos Verstraten) |
Briefly press the rotary encoder. You can now quickly adjust the horizontal and vertical positions and the trigger level by pressing one of the corresponding buttons twice.
Center the image
Press the SEC/DIV, V/DIV or TRIGGER buttons for more than three seconds. The image position and trigger level are reset to the central values.
Save and display the screen
Press the ADJ and SEC/DIV buttons together. The current display is stored in the internal memory. At a later time, press the ADJ and TRIGGER buttons together. The saved screen is displayed. Press and release the OK button to return to the current signal display.
The DSO150 on the test bench
A square wave of 1 kHz
The device has an analogue bandwidth of 200 kHz and a good reproduction of a 1 kHz square wave may not be a problem. What is striking is that the DSO150 has a small trigger-jitter. The image vibrates a bit back and forth, which for viewing the image is simple to solve by pressing the OK-button. The device then switches to the HOLD mode, which means that the last image displayed on the screen is frozen and therefore remains stable. In this mode, you can view the image carefully. Another striking feature is that very few digitizing artefacts are visible in the image.
 |
| A square wave of 1 kHz on the screen. (© 2018 Jos Verstraten) |
Of course we were curious to see how the DSO150 can cope with square waves of higher frequencies. In the figure below we have summarized the results at 10 kHz, 50 kHz and 100 kHz. A device with an analogue bandwidth of 200 kHz must properly represent a 10 kHz square wave. That the DSO150 does not quite pass this test will be clear, after studying the left oscillogram!
 |
| The reproduction of 10 kHz, 50 kHz and 100 kHz square waves. (© 2018 Jos Verstraten) |
The poor reproduction of a 10 kHz square wave probably has everything to do with the rise time of the oscilloscope. This problem is already present in the analog signal processing. The applied op-amps of the type TL084 have a guaranteed slew-rate of only 8 V/μs. The analogue signal passes through three of these op-amps before it reaches the analogue to digital converter. As a result, you cannot expect much from the rise time of the DSO150. In the figure below we have measured a guaranteed steep narrow pulse and the screen display on the DSO150 compared to that on a semi-professional 100 MHz scope. This shows that the rise time of the DSO150 is approximately equal to 0.5 μs/V.
 with that of the DSO5102P (left).") |
| Comparison of the rise time of the DSO150 (right) with that of the DSO5102P (left). (© 2018 Jos Verstraten) |
Cheap digital scopes are notorious for their digital noise, which often causes small signals to perish in this so-called quantisation noise. In that respect, the DSO150 is doing very well. The oscillogram below shows a sinusoidal 1 kHz signal with an effective value of only 10 mV. There is hardly any quantisation noise on the curve.
 |
| Display of a sine wave signal of 10 mV in the highest sensitivity of the DSO150. (© 2018 Jos Verstraten) |
Additions to our test by a reader
We received from a reader of this blog the following useful additions to our test of the DSO150:
- The test signal output interferes with the input when it is at 3.3 V, visible at the 5 mV/div setting, especially if you hold your finger against the test signal output.
- There is a small problem with measuring higher input voltages. Because the two TL084's for the sensitive and the less sensitive position are parallel, the sensitive one is overdriven. With negative input voltages, the total input impedance decreases noticeably. This is clearly visible when using a x10 probe at voltages below -50 V. When measuring a sine wave of 200 V (via a transformer!), a strongly distorted sine wave at the bottom appears on the screen. JYETech has solved this for the most part with the next model, the two-channel version WAVE2. In the jyetech forums, other solutions have also been found. In the picture below you can see this distortion. The distortion at the positive top of the signal has nothing to do with the DSO150. This is due to the saturation of the core of the safety transformer that was used at the input of the scope in this measurement.
 |
| Display of a 200 V sine signal with a DSO150. (© Mat Nieuwenhoven) |
Our opinion on the DSO150
JYE Tech has succeeded well in bringing a usable low-frequency scope to the market at a very low price. What surprised us was the exceptionally beautiful representation of small sinusoidal signals. This makes the DSO150 very suitable for signal research in audio equipment such as mixing amplifiers and analog power amplifiers. The only downside we could discover is the small trigger-jitter which results in a stable image appears on the screen only in HOLD mode.

DSO150 Handheld Digital Oscilloscope