|
We have never tested a device where the discrepancy between specifications and actual performance is so great. The ET601 is completely unusable as an oscilloscope, but perhaps applications can be found in the field of teaching. |
Introduction to the ET601 from ToolTop
Five channels on your PC screen!
In the ads it looks so nice! For barely fifty euros a device that allows you to display five signals on the screen of your PC. Ideal for the student, because to understand the operation of a circuit, the two signals of a standard oscilloscope are often not enough.
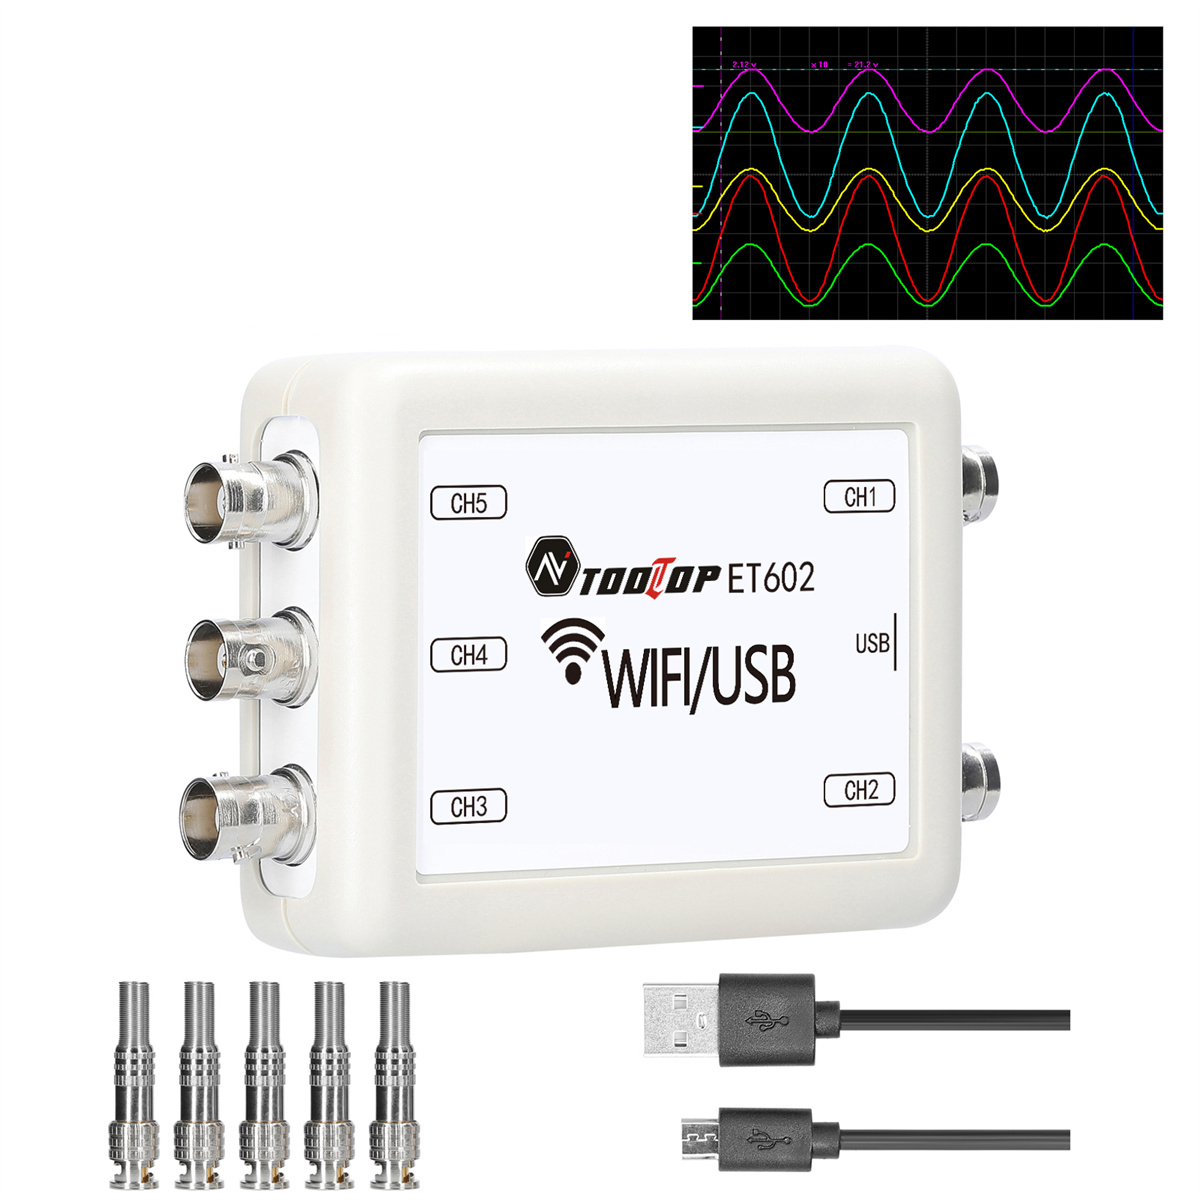
ET601 and ET602 from ToolTop
The device in question, the ET601 from ToolTop, is offered through the well-known Chinese mail order companies at a price of about fifty euros. At Banggood you will pay € 49.26 for it, on AliExpress there are deals for € 50.52.
Besides the ET601 that you have to connect to your PC via a USB cable, there is also a slightly more expensive model PC602 that connects to your tablet or smartphone via WiFi. Since we still prefer working with a real keyboard and mouse, we bought the ET601 and tested it on a Windows 7 and a Windows 10 PC. For this PC version, you need to download the software 'Oscillograph APP 413'.
The appearance of the ET601
As the photo below shows, this five-channel USB oscilloscope is housed in an amazingly small plastic case measuring 90 mm by 70 mm by 28 mm. On the left side are three BNC connectors for channels CH3, CH4 and CH5. On the other side are two identical connectors for channels CH1 and CH2. Between those two inputs is a micro-USB connector for connecting the device to a USB port of a PC. A USB cable is not included, but five unwired BNC connectors are delivered, you need to convert them into usable measurement leads according to your own preferences.
 |
| The scope of delivery of the ET601. (© 2024 Jos Verstraten) |
Specifications of the ET601
According to the manufacturer, this USB oscilloscope has the following specifications:
- Number of analog channels: 5
- Sensitivity: 2 mV/div ~ 1 V/div
- Input impedance: 1 MΩ (<0.5 V/div), 330 kΩ (≥0.5 V/div)
- Input voltage: ±8 V max.
- Input coupling: DC
- Error on voltage measurement: ±2.5 % max.
- Frequency range: 0 Hz ~ 50 kHz
- Time base: 100 μs/div ~ 10,800 s/div
- Sampling rate: 150 kHz
- Supply voltage: 5 Vdc
- Supply current: 170 mA
- Interface to PC: Micro-USB 2.0
- Sample storage range: 5 x 8,388,608 samples
- Sample storage time: 93 hours max.
- Dimensions: 90 mm x 70 mm x 28 mm
- Weight: 90 g
DC coupling only!
The ET601 is probably the only oscilloscope in the world with only DC coupling. This means that if you want to view the ripple on a supply voltage you must include a capacitor in series with the measuring probe to block the DC voltage.
Not only oscilloscope, but also data logger
From the two defined quantities 'Sample storage range' and 'Sample storage time' you can see that the ET601 is not only an oscilloscope but also a data logger. The device stores the measured samples of the five channels in its internal memory.
The electronics inside the ET601
The PCB shown in the photo below completely fills the enclosure. What is immediately noticeable is that some components are apparently hand soldered, see for example the transistors near the BNC connectors. You will notice that there are quite a few active components near these connectors: four transistors and one IC. The latter component is an LM358, a dual op-amp with a unity-gain bandwidth of 1.1 MHz and a slew-rate of 0.6 V/μs. Remarkably, there are no relays or electronic switches in these input circuits. With a sensitivity range of 10 mV/div to 1 V/div, the presence of such components would be obvious.
In the center of the right edge of the PCB is an ICL7660. That is a CMOS voltage converter responsible for generating the necessary negative supply voltage from the +5 Vdc USB voltage.
The heart of the circuit is the LPC2132FBD64 microcontroller from NXP. That's a single-chip 16/32 bit microcontroller with 512 kB of flash memory and a 10 bit wide ADC.
The internal data communication must be translated into a serial data stream going to the USB connector. An FT232RL from FTDI is used for this purpose. This is a UART to USB converter, found on the left side of the PCB.
 |
| The PCB of the ET601. (© 2024 Jos Verstraten) |
Installing the soft- and hardware
Downloading from the Internet
You can download the software 'Oscillograph APP 413' and the inevitable USB driver from:
The two files to download:
- OscillographAPP.rar
- FT232RL.rar
are compressed files that you need to extract to a new folder on your hard drive.
Installing the ET601
Connect the ET601 to a free USB port on your PC via a fully wired micro-USB to USB-A cable. Windows will now start looking for the driver, an action that will go smoothly if you specify the name of the folder where you extracted the FT232RL.rar file.
Afterwards, go to the folder where you extracted the OscillographAPP.rar file and open the OscillographAPP.EXE file. Nothing needs to be installed, all the necessary .DLL and other files are apparently in the folder.
Working with the software
Disappointment!
We have tested many Chinese USB-devices with software and in most cases there is always something to criticize. However, this program 'Oscillograph APP 413' cannot be criticized on details, but on almost all points that are important to work with the ET601.
Norton gives warning
It all starts with the fact that, after double-clicking on the .EXE file, our anti-virus program 'Norton 360' sounds the alarm and detects unwanted network activity. This could be a harmless action, such as searching for a newer version of the software, but it could also be an unwanted program becoming active and collecting a lot of private data from your system and sending it to China. Since we obviously want to test the software, we give permission to run the program anyway.
Missing manual
The second issue is the lack of a manual for this software. It may be just us, but we find this software anything but intuitive, and a number of options and choices make us, at first look, wonder what they are for and how to operate them. The lack of a manual leaves you, the user, to discover all that by experimenting.
The window of 'Oscillograph APP 413'
The screen dump below shows the window of this software. We activated all five channels via the 'View' menu. Note that the software was written for a product that apparently supports eight channels. On the left, you can see five small lines. These are the zero references of the five channels and by clicking on them with the mouse you can move them up and down. If you select the option 'Display custom channel information' in the 'Set' menu, a small frame (at the top right of the screen) appears, which clarifies the relationship between the channels and the colors in the window. You can move this frame around the screen with the mouse.
You will see two thin horizontal lines and two vertical lines. These are the four cursor lines you can use to measure voltages and frequencies. If you enable the trigger function, a marker appears on the left vertical line that allows you to use the mouse to set the voltage level at which to trigger. Strangely, the voltage value between the two horizontal cursors appears legible at the top of the screen, but the measured time and frequency between the vertical cursors is displayed only very small on the bottom line of the window. You will see the notation 'x1' next to the voltage value. By clicking on this you can change this between 'x50,000' and 'x1'. This allows you to set any attenuation of the measuring probe used.
It is worth noting that you can maximize the window but you cannot minimize it. So it always remains on your screen!
 |
The window of 'Oscillograph APP 413'. (© 2024 Jos Verstraten) |
The sensitivity
You can set the sensitivity of the five channels individually by clicking on the colored '▼' and '▲'. The most sensitive setting is 2 mV/div, the most insensitive 1 V/div. In fact, that 1 V/div is too small as the most insensitive setting. The screen contains ten divisions. If you connect the output voltage of a digital circuit supplying 5 V as the 'H' level to an input, the image already occupies five of the ten divisions. If you enable the five channels and put signals on these inputs that switch between 0 V and +5 V, these signals get in the way of each other on the screen. It is not possible to display these signals neatly among each other! To get things neatly on the screen, you are obliged to work with 1/10 attenuators on all channels. However, you probably have only two oscilloscope probes with such a built-in 1/10 attenuator.
The time base
You can set the time base by clicking the two black '◄' and '►' buttons. To our surprise, you can set the time base to a fastest setting of 1 ns/div. That this is absolute nonsense will be obvious without further explanation. The slowest setting is 10,800 s/div. To put that into perspective, 10,800 seconds corresponds to three hours! Such settings are of course completely useless if you want to use the ET601 as an oscilloscope, but are useful if you want to turn it on as a data logger.
The 'Trigger' menu
The Trigger menu allows you to select one of five channels as the trigger source. You can trigger on either the rising or falling edge of a signal. This seems like an excellent feature; however, the problem is that the triggering usually does not work. Even with an ordinary sine wave with a frequency of 1 kHz, we do not get a steady image on the screen. Not surprisingly, all the videos the various providers have on their Internet sites show only signals running across the screen.
Fortunately, by pressing the 'Enter' key on your PC you can 'freeze' the ET601 so that a steady image appears on the screen. After a second press of the 'Enter' key, the unit restarts.
Furthermore, the triggering works only if you set the speed to values faster than 100 ms/div.
The 'Measurement' menu
In this menu you can choose between:
- Disabled
- Measuring peak
- Measuring the top
- Measuring the bottom
In the three 'Measuring' options, the two horizontal cursor lines follow one or both peaks of the signal and the voltage value between these two lines is displayed on the screen. The measured values are generally quite accurate.
The 'Spectrum' menu
This option, the software claims, allows you to display the frequency spectrum of one or more channels on the screen. However, what you get to see on the screen are a bunch of indefinable vertical lines that have nothing to do with a frequency analysis. Even the analysis of a pure sinusoidal signal produces such a result! In short, a completely useless function!
Testing the ET601
The bandwidth
The bandwidth is specified from 0 Hz to 50 kHz. However, with a sampling rate of only 150 kHz, we do not believe much of this specification. We always check the bandwidth of an oscilloscope by putting a sine wave with a frequency of 1 kHz as large as possible on the screen and setting the cursor lines at the peaks of this signal. Afterwards, we increase the frequency of this signal until the peak-to-peak value of the signal has dropped to 0.707 of the value at 1 kHz. Indeed, this corresponds to a 3 dB attenuation, the standard definition of bandwidth.
These measurements are not possible with the ET601. As the screen dumps below show, the sinus signal is so distorted with increasing frequency that no meaningful measurement is possible! Even at 20 kHz, the displayed signal hardly resembles a sine wave.
Clearly, too few samples are taken and the software is unable to reconstruct the shape of the signal from these samples. Apparently, the software does not use the sin(x)/x algorithm common in digital oscilloscopes, but works with a linear interpolation between the sample points.
What does go well is the calculation of the signal magnitude. The 4.0 V peak-to-peak of our function generator DG1022 from Rigol (it works very accurately) is represented as 3.86 V.
 |
| Representation of a sine wave at increasing frequency. (© 2024 Jos Verstraten) |
Representation of small signals
It is clear from the oscillograms shown in the previous figure that quite a bit of digital noise is present on the signals. This makes one fear the worst for the reproduction of small signals! That this is all too true is shown in the picture below, where you can see how the ET601 reproduces a sine wave with a frequency of 1 kHz and a peak-to-peak value of 10 mV. There is so much digital noise on the displayed signal that it is completely unusable. In addition, the ET601 displays a peak-to-peak value of 16 mV, which is a rather large deviation. The algorithm in which the software looks for the peaks of the signal no longer works. Third, you can see that the system introduces a large offset error, so the signal is no longer displayed symmetrically with respect to the zero axis.
 |
| Display of a sine wave of 10 mVptp. (© 2024 Jos Verstraten) |
Display of square-wave signals
In the following test, we presented nice square-wave pulses with a peak-to-peak value of 4.0 V to one input of the ET601. Again, we find that the oscilloscope completely fails when the frequency goes above 1 kHz. The peak-to-peak value does display fairly accurately: 3.89 V ~ 3.90 V ~ 3.88 V.
 |
| Measurement of square wave signals. (© 2024 Jos Verstraten) |
What the ET601 is well suited for
Introduction
You will agree with us that those few tests we performed prove that this device:
- Is, unfortunately, completely unsuitable for its function as an oscilloscope.
- Is accompanied by specifications that are far too optimistic.
Still, this is not to say that the ET601 is totally useless. If you work very low frequency and provide signals of sufficient size, images will appear on the screen that do bear some resemblance to the signals you provide at the inputs. We conclude this test with a few examples of useful applications of this USB oscilloscope.

Explaining the working of an astable multivibrator
Every electronics enthusiast naturally knows by heart the schematic of an astable multivibrator composed of two feedback transistor stages. The operation of such a circuit can be understood from the time course of the voltages at the two bases and the two collectors. With a standard oscilloscope, however, you can visualize only two of the four signals. With the ET601, it is no problem to unite those four signals among each other in one picture. In the example below, we had the astable multivibrator generate a signal with a frequency of only 33.5 Hz, something that even the ET601 obviously has no trouble with.
Applied this way, this inexpensive little device can be an excellent aid in electronics education.
 |
The operation of an astable multivibrator. (© 2024 Jos Verstraten) |
Explaining the operation of digital circuits
You can apply the ET601 in the same way to illustrate the operation of digital ICs, such as flip-flops, counters and dividers. As an example, the oscillogram below shows the four first outputs of a frequency divider type CD4040BE. Since we do not own four identical frequency compensated 1/10 oscilloscope probes, we have terminated the four outputs of the IC with an ordinary uncompensated resistor divider. Hence probably the overshoot on the edges of the pulses.
 |
| The operation of a frequency divider in pictures. (© 2024 Jos Verstraten) |
Recording slow varying phenomena
For logging very slow varying voltages, such as those provided by sensors, the ET601 is ideal. The screen dump below shows the result of logging the output signal of our function generator with a frequency of 0.01 Hz. We have played a bit with the knobs, so that different signal shapes are generated during one full-screen logging. The time base of the ET601 is set to 20 s/div.
 |
| Recording a very slowly varying voltage. (© 2024 Jos Verstraten) |
Exporting the samples
You can save the display in the form of an xxxxx.OSC file that you can later reload into the ET601 software for further observation. Additionally, you can export the samples to a xxxxx.TXT file, as is the case with most data loggers. To do this, go to the 'File' menu and choose the 'Safe the screen data' option. In the picture below, you can see how the data is recorded in this xxxxx.TXT file.
Attention!
However, the numbers show that the numerical data are not referred to the zero lines of the signals, but to the bottom of the screen which is apparently given the value '000'. As a result, a signal never becomes negative, which obviously contradicts reality. This rather stupid decision by the programmers makes mathematical processing of the data impossible.
 |
| The samples as a xxxxx.TXT file. (© 2024 Jos Verstraten) |
You can load such a standard text file into most data analysis or presentation software to further evaluate or edit the data. In the illustration below, for example, you can see how the output signals of the CD4040BE were exported to the program 'Graph-in-the-box' and extracted from this program again in a JPG graph form.
 |
| The .TXT file converted into a graph. (© 2024 Jos Verstraten) |

Tooltop ET601/ET602 USB-oscilloscope