|
Priced at about € 140.00, the 1014D from the Chinese company FNIRSI is an easy-to-use entry-level oscilloscope for the hobbyist who does not (yet) want to spend a lot of money on equipment. |
Introduction to the 1014D oscilloscope
Manufacturer, suppliers and prices
Although this device is offered under a different name on some sites, it is quite clear that the Chinese FNIRSI is the designer of this oscilloscope. This device is popular and is offered by dozens of suppliers through Banggood, AliExpress and Amazon. Prices vary quite a bit, the lowest price we can find at the time of writing this article is € 141.67 at Banggood.
By the way, don't be fooled by some vendors who quote prices of around € 75.00 via Google. If you search on those sites, a completely different device is offered for that amount!
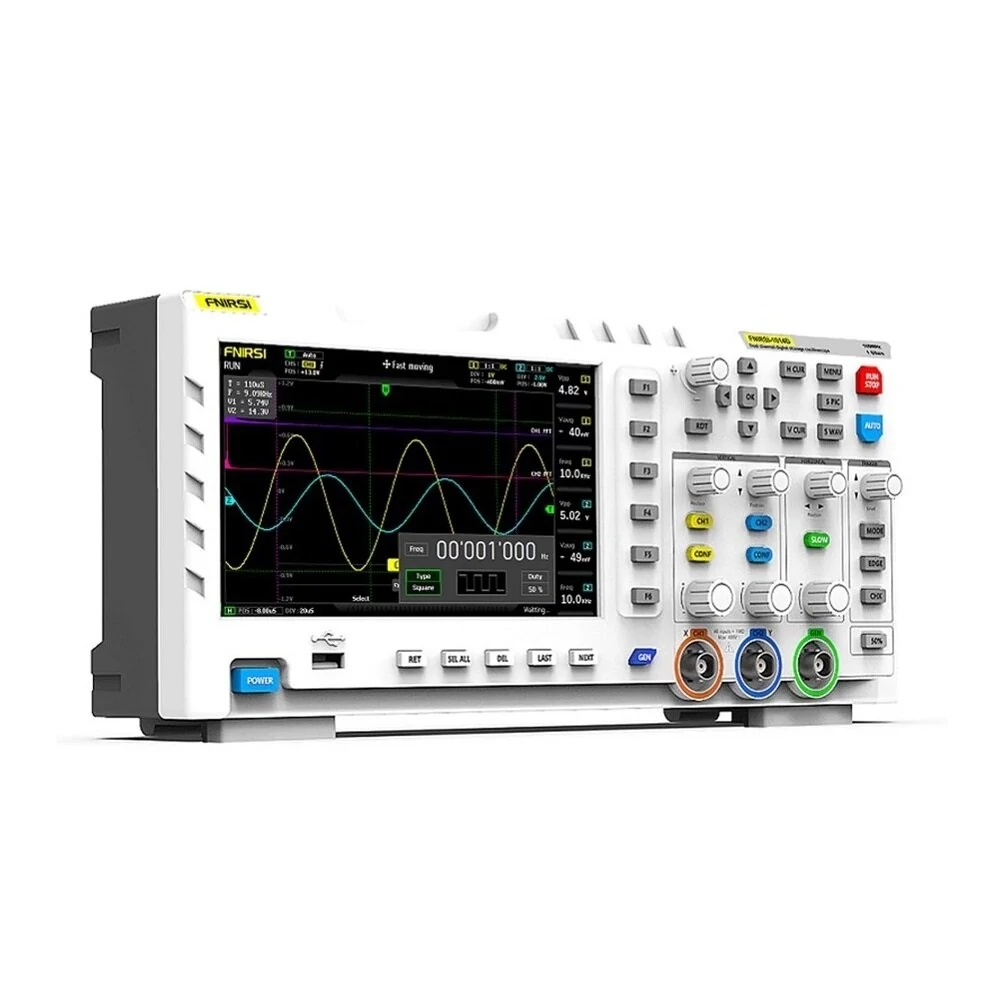
The appearance of the 1014D
As the picture below shows, the 1014D looks like what a modern digital oscilloscope should look like. Thanks to the generous front panel dimensions of 31.0 cm by 14.5 cm, all 43 buttons are easy to operate. The device is only 7.5 cm deep and weighs 1.5 kg. With the fold-out feet, it stands at a good angle on the workbench.
 |
| The appearance of the 1014D. (© AliExpress) |
What you get for your money
The manufacturer delivers a comprehensive package:
- The 1014D oscilloscope
- A 20-page manual
- A mains plug power supply with an American plug
- An adapter to European wall sockets for the mains plug power supply
- A power supply cable
- A USB-A to USB-A cable
- Two measuring probes
- A BNC to alligator clip cable
- An adjustment screwdriver for the measuring probes
.") |
| The scope of delivery of the 1014D, not to scale. (© 2024 Jos Verstraten) |
The manual
The manual is a beautifully laid out booklet in English. Strangely, it hardly uses pictures to explain the operation and handling of the oscilloscope. We have included this manual on our account at archive.org and you can view this booklet at:
Specifications of the 1014D
According to the manufacturer, this oscilloscope has the following specifications:
- Channels: 2
- Display: 7 inch full-color LCD, 800 x 480
- Bandwidth: 2 x 100 MHz
- Sampling rate: 1 GSa/s
- ADC width: 8 bit
- Rise time: less than 3 ns
- Memory depth: 240 kb
- Input impedance: 2 x 1 MΩ
- Sensitivity: 50 mV/div ~ 5 V/div (7 steps)
- Protection: up to 400 V peak-to-peak
- Input coupling: AC/DC
- Time base: 50 s/div ~ 10 ns/div (30 steps)
- Trigger mode: single / normal / auto
- Trigger start: rising / falling
- Accuracy numeric voltage display: ±5 %
- Numeric frequency display accuracy: ±0.01 %.
- Power supply: 5 Vdc / 2 A
- Dimensions: 310 mm x 145 mm x 70 mm
- Capture screen: 1,000 images
- Capture waveforms: 1,000 signals
- Frequency function generator: 1 Hz ~ 10/2 MHz
- Output function generator: 14 waveforms
- Data output: via USB
- Cursors: 2 x horizontal, 2 x vertical
- Numerical measurement: VPP, VP, Vmax, Vmin, Vavg, Vrms
- Numerical measurement: frequency, duty+, duty-, time+, time-, period
The advantages of the 1014D
- This oscilloscope is clearly an entry-level model with limited functionality, making it very intuitive to operate even by someone who is not very experienced with such devices.
- The 1014D has no built-in power supply, but is powered from an external 5 Vdc voltage. A simple mains plug power supply is included but you can also power the device from a 5 V power pack capable of supplying 2 A. The oscilloscope can then be used anywhere, even where there is no mains voltage nearby.
- With one press of the 'AUTO' button, the 1014D auromatically calculates the best settings of sensitivity and time base.
- A primitive function generator is built-in with a frequency range of 1 Hz to 10 MHz for sine waves and 1 Hz to 2 MHz for all other signals. You can choose from 14 signal shapes present in the device.
- You can save the signal that appears on the screen to memory after a few simple operations and use it as the self-defined output signal of the function generator.
- You can save the screen image to the internal memory with one press of the 'S PIC' button. That memory has capacity for 1,000 images.
- By pressing the 'S WAV' button once, you can store both input signals in the memory and recall them afterwards. It then appears as if the oscilloscope has those images as input and you can run all the functions of the 1014D on them, such as changing time base and sensitivity, FFT analysis, etc.
- You can connect the oscilloscope to your PC via the USB cable and export the stored images to the hard disk.
- You can numerically display the value of a total of six parameters of both input signals.
- The 1014D can perform a very rudimentary frequency analysis of both input signals according to 'Fast Fourier Transform'.
- The 'H CUR' and 'V CUR' push buttons allow you to turn on two horizontal and two vertical cursor lines to measure times and voltages numerically.
- You can switch the oscilloscope to X/Y mode, which allows you to put the familiar Lissajous figures on the display.
- The two inputs are protected against peak voltages up to 400 V.
The limitations of the 1014D
- The vertical sensitivity of 50 mV/div cannot be called spectacular. Most oscilloscopes have a sensitivity of at least 10 mV/div.
- The mains plug power supply provided is not of excellent quality and causes strange phenomena (read on).
- The specified bandwidth of 2 x 100 MHz turns out to be grossly exaggerated in practice.
- The same applies to the sampling rate. It is specified as 1 GSample/s, but that is a value provided by the software. The hardware speed of the applied ADC is only 200 MSamples/s.
- The built-in function generator provides signals with a fixed peak-to-peak value of 2.5 V. That the amplitude of the output voltage is not adjustable basically makes this option an unusable and unnecessary toy.
- The specified rise time is nonsense! The measured value is much larger and inconsistent with the specified bandwidth of 100 MHz.
- The 1014D does NOT have an external trigger input!
Averaging on the image
The 1014D is clearly not a real-time oscilloscope! The 1014D uses a technique called 'averaging'. This involves storing a large number of successive images in memory. Afterwards, the software calculates the average value of all saved images. That 'average' image is then sent to the screen. The advantage is that a nice stable oscillogram appears on the screen. The disadvantage is that short, one-off phenomena such as a small interfering pulse are lost in the averaging process and therefore do not appear on the screen. With most digital oscilloscopes, you can turn averaging on or off. With the 1014D, you cannot.
The 1014D is clearly not a real-time oscilloscope! The 1014D uses a technique called 'averaging'. This involves storing a large number of successive images in memory. Afterwards, the software calculates the average value of all saved images. That 'average' image is then sent to the screen. The advantage is that a nice stable oscillogram appears on the screen. The disadvantage is that short, one-off phenomena such as a small interfering pulse are lost in the averaging process and therefore do not appear on the screen. With most digital oscilloscopes, you can turn averaging on or off. With the 1014D, you cannot.
The internal electronics
The two parts of the all-plastic housing are connected by seven screws. The large PCB is fixed against the front panel of the oscilloscope. In the picture below, you can see the two sides of this PCB, where we used the pictures from 'pcprogrammer' on 'eevblog' as a reference.
There is surprisingly little electronics to be discovered on this PCB. Most of the chips have been made illegible. Clearly recognizable are an F1C100S and an EF2L45LG144B.
The F1C100S is a system-on-chip (SoC) developed by the Chinese company Allwinner Technology. It is a relatively simple interface between a system and a digital display. A lot of digital photo frames use this chip. The F1C100S is based on a single-core ARM926EJ-S processor with a clock speed of up to 900 MHz, and the chip includes a built-in 2D graphics accelerator.
The EF2L45LG144B from China's Anlu Technology Anlogic is an FPGA (Field Programmable Gate Array), a complex logic block containing thousands of logic circuits that can be uniquely interconnected via software. This chip undoubtedly incorporates the entire control logic of the 1014D.
 |
| The two sides of the PCB. (© 2022 pcprogrammer, edit 2024 Jos Verstraten) |
What stands out, on the left side of the PCB and framed in green by us, is a metal holder for a memory card. There is indeed a card in this holder and it is obvious to assume that the 1,000 screenshots you can save are stored on this card. The input circuits, framed in red by us, each contain three mini-relays used to switch the input sensitivity. You can clearly hear those relays clicking as the oscilloscope searches for the best input sensitivity via the 'AUTO' function. Both circuits are fully encapsulated, that shielding has been removed in the photo above.
According to sources on the Internet, the 1014D uses two AD9288-type ADCs that sample the two analog input signals. Each chip contains two identical 8 bit wide ADCs with a maximum sampling frequency of 100 MSa/s. It is hard to see how a real-time sampling rate of 1 GSa/s can be achieved with such chips, as claimed by the manufacturer. If both ADCs in one chip sample the same signal in parallel with a clock signal shifted in phase, then the sampling frequency is 200 MSa/s. So the hardware sampling rate is much lower than 1 GSa/s and an oversampling algorithm is applied via software.
Through a rectangular cutout present in the PCB, the electronics are connected to the display via a flat ribbon cable.
Working with the FNIRSI 1014D
Problems with the mains plug power supply
We connected the device to the mains voltage via the provided mains plug power supply. Immediately after switching on the device and applying a 1 kHz square wave voltage to 'CH1', it appeared that the image was very unstable and strange peaks could be seen in the signal from time to time, see image below. After some experimentation, the mains plug power supply turned out to be the problem. After powering from a 5 V power pack, these problems disappeared like snow in the sun and the device performed excellently.
 |
| The first disappointing measurements with the 1014D. (© 2024 Jos Verstraten) |
The display of the 1014D
The display has a width of 15.2 cm and a height of 8.5 cm. Around the window where the two signals appear are various data from which you can read the setting of the oscilloscope. This abundance of data on the screen is necessary because there is no text next to the control buttons. The data are grouped and each group contains the status of a particular function of the oscilloscope. We have summarized this clearly in the figure below:
- A: Data from the trigger setting
- B: Data from the setting of channel 'CH1'
- C: Data of the setting of channel 'CH2'
- D: Six numeric data of the two signals
- E: Status of triggering
- F: Data of time base settings
 |
| A lot of data is shown on the display. (© 2024 Jos Verstraten) |
The control buttons of the 1014D
In the picture below, you can see that you have to operate the oscilloscope with 33 pushbuttons, five rotary potentiometers (the small knobs) and three rotary encoders (the large knobs). That seems a lot for the starting hobbyist, yet after some practice you will be able to operate the device flawlessly. In the paragraphs below, we will briefly explain the function of those buttons.
 |
| The control buttons of the 1014D. (© 2024 Jos Verstraten) |
Menu options
After pressing the 'MENU' button, the following window will appear on the display. With the cursor keys '▼' and '▲' you can select one of the eleven options. Pressing the 'OK' button opens this option.
 |
| The eleven options of the menu. (© 2024 Jos Verstraten) |
Option 1: Picture browsing
The screen displays all the screenshots stored in memory. The four cursor keys '◄', '►', '▼' and '▲' allow you to select one of the pictures. The five buttons 'SEL', 'SEL ALL', 'DEL', 'LAST' and 'NEXT' below the screen allow you to scroll through the screens, select and delete the images.
 |
| The menu option 'Picture browsing'. (© 2024 Jos Verstraten) |
Option 2: Wave browsing
Identical to the screenshots stored in memory. After selecting one of the waves, press 'OK' and this wave reappears on the oscilloscope screen as if it were the input signal. You can then apply all the functions of the oscilloscope to it.
Option 3: Output browsing
Here the waves are saved, which you have selected via the 'Capture output' function to be loaded into the function generator as a self-defined signal shape.
Option 4: Capture output
Two purple vertical cursor lines appear, which you can select with the cursors '◄' and '►' and move across the screen with the rotary knob next to the cursors. The part of the signal between the two cursor lines is stored in the 'Output browsing' memory.
Option 5: Screen brightness
You can set the intensity of the display.
Option 6: Scale brightness
You can set the intensity of the scale display.
Option 7: Automatic 50%
You can enable or disable the automatic trigger level setting at half the peak-to-peak value of the signal.
Option 8: X-Y mode curve
The time base is turned off. The signal on 'CH1' causes the spot on the screen to move up and down (X) and the signal on 'CH2' causes the spot to move back and forth (Y). This option allows you to write the familiar Lissajous figures on the screen. This allows you to visualize phase and frequency differences between the two signals.
 |
| The menu option 'X-Y mode curve'. (© 2024 Jos Verstraten) |
Option 9: Base calibration
With this option you can make the baselines of both channels coincide with the yellow and light blue triangles on the left side of the screen. This option should only be used with open inputs!
Option 10: USB export
The memory of the 1014D becomes an external hard drive that you can access and manage via Windows' 'Explorer'. This option allows you to export screenshots stored in memory to your PC's hard drive.
Option 11: Factory setting
All settings are reset back to factory values.
The buttons 'AUTO' (blue) and 'RUN/STOP' (red)
If you press the 'AUTO' button, the 1014D will automatically select the best positions of sensitivity and time base, so that a nice quiet image appears on the display. Pressing the 'RUN/STOP' button freezes the image on the display or puts the unit back to work.
Setting both channels
With the lower large rotary knobs you can adjust the sensitivity between 50 mV/div and 5 V/div in 7 steps. With the smaller rotary knobs you move the signals up and down. With the push buttons 'CH1' and 'CH2' you switch the channels on or off. With the two push buttons 'CONF' you define all settings of both channels. After pressing one of these buttons the window below will appear. In this window you can configure the channel, again with the cursor keys and the button 'OK':
- Probe:
You must enter the attenuation of the measurement probe here so that the oscilloscope can incorporate this attenuation in the display of the numerical voltage values. - Coupling:
Direct voltage in the signal is displayed (DC) or not displayed (AC). - FFT:
The 'Fast Fourier Transformation' (the frequency composition) of the signal is displayed or not displayed on the screen. By the way, this is a very limited version of a real FFT, with which you can do little. As far as we are concerned, this feature could have been omitted!
 |
| The setting of both channels. (© 2024 Jos Verstraten) |
Time base setting
The lower large rotary knob selects the time base speed between 50 s/div and 10 ns/div in 30 steps. The smaller rotary knob moves the signals back and forth on the screen. The 'ORIG' knob sets the point at which the 1014D triggers in the center of the screen. The green arrow at the top of the screen defines the location of this trigger point.
Trigger settings
The one rotary knob sets the trigger level. The four push buttons:
- MODE:
Chooses between 'Single', 'Normal' and 'Auto'. The usual option is 'Auto'. If you do not get a steady image, select 'Normal'. With 'Single', after reaching the trigger level, only one image is written. - EDGE:
Select triggering on rising or on falling signal. - CHX:
Triggering on input 'CH1' or input 'CH2'. - 50%:
Automatically triggers on a voltage exactly in the middle between the maximum and minimum values.
The function buttons 'F1' to 'F6'.
These buttons allow you to numerically measure a total of six parameters of signal 'CH1' and/or of signal 'CH2'. After pressing one of the buttons, the window below appears on the screen. With the cursor keys you can select a parameter. Press 'OK' to confirm this selection.
 |
| Selecting the six parameters that appear numerically on the screen. (© 2024 Jos Verstraten) |
The 'SLOW' key
This key allows you to make the six rotary potentiometers less sensitive so that you can set the relevant function more precisely.
The 'GEN' key
This key opens the little window below where you can configure the output signal of the function generator. You work again with the cursor keys and the 'OK' key. The signal appears with a fixed peak-to-peak value of 2.5 V on the green BNC connector.
- Freq:
Selects the frequency of the output signal. The lowest frequency is 1 Hz, the highest is for sine wave 10 MHz and for other signals 2 MHz. - Duty:
For rectangular signals, defines the high/low ratio of the signal. You can set this parameter from 1 % to 99 %. - Type:
You can choose from 14 predefined signal shapes. In addition, you have the option to add one signal shape yourself. This is done as follows. Open the menu and select the 'Output browsing' option. Select one of the signal shapes that you have stored in memory via the 'Capture output' option. Press 'OK' and exit the menu. Then press the 'GEN' button and select the 'Type' option. You will now see under 'Custom' the signal shape you selected.
 |
| Setting the signal of the function generator. (© 2024 Jos Verstraten) |
Test of the oscilloscope in the 1014D
Introduction
Most reviewers of this oscilloscope feel that the manufacturer publishes far too optimistic specs. This applies in particular to bandwidth, sampling rate and rise time. Naturally, we tested this ourselves and we have to conclude that our colleagues are right. Both the specified bandwidth of 2 x 100 MHz and the rise time of less than 3 ns are grossly exaggerated.
To put things in a competitive perspective, in our tests we used our own oscilloscope, an XDS2102A from OWON, as a comparison. This device is admittedly much more expensive than the 1014D, but this is because this oscilloscope works with 12 bit instead of 8 bit and has a lot of extra features. However, the specified bandwidth and rise time are similar: 2 x 100 MHz and less than 3.5 ns.

Testing the sampling rate with 50 MHz sine wave
This quantity refers to the number of samples per second an oscilloscope takes of the input signal. A high sampling rate results in more accurate reconstruction of high-frequency signals. According to the Nyquist-Shannon theorem, the sampling rate must be at least two times higher than the frequency of the input signal to ensure accurate on-screen reproduction. Therefore, a signal with a frequency of 50 MHz requires a hardware sampling rate of at least 100 MSa/s. This is what the ADC used in the 1014D is capable of. So why is a sampling rate of 1 GSa/s specified? Because a technique called 'oversampling' is used in this digital oscilloscope. This involves that the software collects and merges the results of five or even ten consecutive, but slightly time-shifted sample cycles. This technique is also used in digital audio, for example.
When reconstructing the signal on the oscilloscope screen, a mathematical algorithm called 'sin(x)/x interpolation' is applied. This involves connecting the successive signal samples that appear as dots on the screen by lines that approximate the original shape of the signal as closely as possible.
To judge the 1014D's high frequency display performance, we presented a nice sine wave signal at a frequency of 50 MHz from our Marconi sine wave generator TF2015 to the inputs of both oscilloscopes. You can see the results in the oscillograms below. We can be very satisfied with that, we have tested so-called 100 MHz oscilloscopes that are completely out of tune at 50 MHz. The only criticism is that the signal is not displayed symmetrically with respect to the zero axis. The positive part is clearly larger than the negative part. But we can live with that!
Note that here we are only assessing the reconstruction of the signal and this test says nothing about bandwidth!
 |
A 50 MHz sine wave on the screen of both oscilloscopes. (© 2024 Jos Verstraten) |
Definitions of bandwidth and rise time
It may be necessary for some readers to first explain what is meant by 'bandwidth' and 'rise time' of an oscilloscope.
Bandwidth is the frequency at which the screen display of a sine wave signal is 3 dB smaller than the display of an equally large 1 MHz sine wave signal. Converted to unit length, this corresponds to a decrease in screen amplitude by a factor of 0.707. If a 1 MHz sine wave is displayed with a height of 10 cm, the bandwidth is determined by the frequency of an equally large signal that appears on the screen with a height of 7.07 cm. In the example below on the left, the oscilloscope would have a bandwidth of about 64 MHz.
The rise time is the time it takes your oscilloscope to display 80 % of the leading edge of an extremely fast pulse. As shown in the figure on the right, we calculate that 80 % from the time t1 when the device has written 10 % of the amplitude to the time t2 when 90 % of the amplitude has been written. So in this example, the rise time is equal to the time lag between times t1 and t2.
 |
| Definitions of bandwidth and rise time of an oscilloscope. (© 2024 Jos Verstraten) |
Testing the rise time
For this, we use a Chinese PCB named 'Fast Edge Pulse Generator' that delivers a rectangular signal of 1.000 MHz with rise and fall times less than 180 ps. That value is negligible compared to the rise times of the oscilloscopes. So you can conclude that the rise times you see on the screens are caused by the electronics in the devices. This PCB plugs directly into the BNC input of the oscilloscope. So cable parameters cannot affect the display of the signal.
You can see the results of this test in the figure below. It is now clear that the 1014D completely fails. The specified rise time of less than 3 ns is nonsense, we measured 11.6 ns. With the XDS2102A, the specifications are perfectly correct, the measured rise time is 3.04 ns.
 |
| Measuring the rise times of both oscilloscopes. (© 2024 Jos Verstraten) |
Calculating the bandwidth from the rise time
There is a simple mathematical relationship between rise time and bandwidth:
Bandwidth (MHz) = 350 / rise time (ns)
Apply this formula to both oscilloscopes:
- FNIRSI 1014D: 350 / 11.6 = 30.17 MHz
- OWON XDS2102A: 350 / 3.04 = 115.13 MHz
So little remains of FNIRSI's claim that the 1014D has a bandwidth of 100 MHz!
Direct measurement of bandwidth
A second method to check the bandwidth of an oscilloscope is to use a very wideband sine wave generator. The condition, however, is that this device is guaranteed to have an absolutely straight amplitude/frequency characteristic. This means that if you set an output voltage of 1.0 V, the device delivers an output voltage of 1.0 V at all frequencies. Our sine generator TF2015 from Marconi meets this requirement. Such a measurement goes as follows. You first input a signal at a frequency of 10 MHz and set the horizontal cursors at the peaks of the sine wave. You slowly increase the frequency, obviously leaving the sensitivity of the oscilloscope in the same position. You will see the signal on the screen getting smaller and smaller. Somewhere there is a frequency at which the peak-to-peak value of the sine wave becomes equal to 70 % of the distance between the two cursors. That is the bandwidth of the oscilloscope.
We applied this measurement to both oscilloscopes, using frequencies of 10 MHz, 20 MHz, 50 MHz and 100 MHz. To eliminate the heavy capacitive load of the inputs of the oscilloscopes, we use well adjusted 1/10 probes with a bandwidth of 100 MHz in both cases.
The results are summarised in the figure below. It clearly shows that while the 100 MHz bandwidth specification is easily met with the OWON XDS2102A, this is definitely not the case with the FNIRSI 1014D. The signal attenuation to 70.7 % is somewhere between 20 MHz and 50 MHz. So the calculated value from the rise time of 30.17 MHz will be correct! The signal attenuation goes up so fast above 50 MHz that nothing at all appears on the screen from the 100 MHz signal.
Note that this does not mean that you will never see a 100 MHz signal on the 1014D's screen. The TF2015 sine generator produces a very small output signal that moreover is ten times attenuated (the 1/10 probe!) at the input of the oscilloscope. If you put a sufficiently large 100 MHz sine wave on the input (and you should think of a signal with a value in the volt range), then the 1014D can indeed digitise it and you will probably see something on the screen. However, we do not have a generator that delivers such high HF voltages, so we cannot prove this assumption.
 |
| Direct measurement of bandwidth. (© 2024 Jos Verstraten) |
The representation of a 1 MHz square wave
The printed circuit board 'Fast Edge Pulse Generator' produces a super nice symmetrical square wave with a frequency of exactly 1.000 MHz. The next test is how both oscilloscopes display this signal on their screens. The 1014D performs beyond expectations here! The numerical display of the frequency on the screen is also accurate: 1.00 MHz.
 |
The display of a very steep 1 MHz square wave. (© 2024 Jos Verstraten) |
Influence of avaraging on the reproduction of non-periodic signals
As already written, the 1014D works with 'avaraging' that cannot be switched off. It is not a real-time oscilloscope! This technique in which various sampling cycles are interwoven by the software works excellently for the representation of stable periodic signals. However, if you want to measure a non-periodic signal, little will come of that measurement on an oscilloscope that works with avaraging.
To check how a non-periodic signal is displayed we measure noise with both oscilloscopes. That's an excellent example of a non-periodic signal. Both devices are set to identical settings: 50 mV/div and 100 ns/div.
You can clearly see here that according to the 1014D the signal is much smaller than what the XDS2102A claims. In practice, you must take this limitation of the 1014D into account!
 |
| The display of noise on both oscilloscopes. (© 2024 Jos Verstraten) |
The linearity of the ADC
If you apply an absolutely linearly increasing voltage to an oscilloscope (an ideal sawtooth), that voltage should also appear as a straight line on the screen. Any deviation is caused by imperfections in the operation of the ADC. In the image below we compare what the 1014D and the XDS2102A make of it and it becomes clear why one oscilloscope costs 150 euros and another costs 400 euros.
 |
| Display of a linearly increasing voltage. (© 2024 Jos Verstraten) |
Delay between both channels
One of the most important applications of two-channel oscilloscopes is to compare the time relationship between two signals. To do this properly, it is necessary that the electronics in the oscilloscope do not cause delays between the two channels. We have tested this over the entire frequency range from 0 Hz to 50 MHz and we cannot detect any delays. The oscillogram below shows the screen if you apply a 50 MHz sine wave to both inputs. Both images are completely identical.
 |
| Testing the signal delay between both inputs. (© 2024 Jos Verstraten) |
Test of the function generator in the 1014D
Introduction
One of the most important requirements of any signal generator is that you can accurately adjust the magnitude of the output signal. The function generator present in the 1014D does not have that option and that is why we consider this to be an unnecessary toy rather than a useful option. However, we have carried out a few tests where we use our XDS2102A to show you the results.
The sine wave signal at 10 MHz
The oscillogram below shows what the sine wave voltage with the maximum frequency of 10 MHz looks like. Settings of the XDS2102A: 500 mV/div and 20 ns/div. You will clearly notice some signal distortion, but we are very satisfied with this result. We have tested many worse performing generators!
 |
| The output of the function generator at 10 MHz sine wave. (© 2024 Jos Verstraten) |
This signal distortion quickly decreases if you set the frequency lower. For example, in the screenshot below you can see the distortion analysis at 100 kHz. The total harmonic distortion has dropped to 0.7 %, an excellent value for such a cheap device. As the photo shows, the harmonic distortion (blue trace) consists mainly of digital noise, the result of imperfections in the DAC that generates the analog signal from the digital codes in the memory.
 |
| The distortion on a 100 kHz sine wave signal. (© 2024 Jos Verstraten) |
The square wave signal at 2 MHz
To conclude this very extensive review/test of the FNIRSI 1014D, we show you in the figure below the output signal of the function generator, set to a rectangular voltage with a frequency of 2 MHz.
 |
| The output of the function generator at 2 MHz square wave signal. (© 2024 Jos Verstraten) |
Our opinion about the FNIRSI 1014D
The FNIRSI 1014D will undoubtedly receive no praise from professional electronics engineers and supporters of the 'everything-from-China-is-worthless'-nonsense. Its real bandwidth (≈30 MHz) is too small for that and its real rise time (≈11.6 ns) is too long. But if you are looking for a very affordable and easy-to-use entry-level model, this oscilloscope is ideal.
Its strengths obviously do not lie in performing RF measurements or accurately measuring the amplitude of signals. But the average hobbyist doesn't need that either. For most measuring jobs on audio amplifiers, experiments with Arduinos and similar hobby activities, the 1014D can without a doubt become your indispensable and reliable instrument. The controls are simple and intuitive to operate, the oscillograms are clear.
An advantage is definitely the possibility to power the device from a 5 V power pack. A handy do-it-yourselfer could even install a battery, 5 V stabilizer and charging electronics in the largely empty space in the housing.
In our opinion, the 1014D can be recommended without any reservations to hobbyists and schools and for carrying out the majority of common repairs to electronic devices.

FNIRSI 1014D oscilloscope